Easy XICs with MZmine
on Blog, Lc/ms
Following Matt Might’s “Reply to public” blogging tip, here is a step-by-step tutorial (with pictures!) for converting low-resolution (e.g. ion trap, quadrupole) LC/MS data into the .mzML.gz (gzipped, mzML) file format, followed by data analysis & figure generation using the MZmine2 LC/MS data analysis software.
MZmine2 is free, open source software that can be installed on Mac/Windows/Linux, and can directly read the .mzML.gz (or .mzML) file format for data processing and figure generation. I find it more convenient for LC/MS data analysis than the vendor software, as I can do everything on my own laptop, rather than having to use the instrument computer. MZmine2 is also very well suited for analysis of high-resolution LC/MS data (e.g. QToF, Orbitrap)
Note: If your instrument produces LC/UV data alongside the LC/MS data, it probably does not also get converted into .mzML format, so you can’t (yet?) use MZmine2 to view that. But to be fair, LC/UV data is probably better suited for something like the more general & still work-in-progress AnIML file format, rather than the LC/MS oriented .mzML.
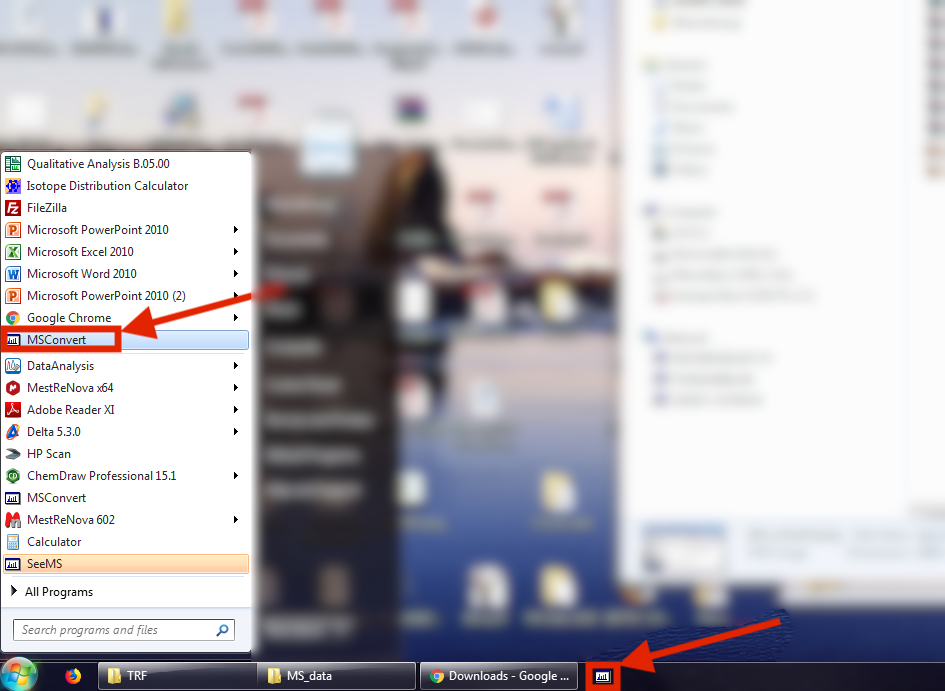
1. Install and open MS Convert. MS Convert with is a part of the ProteoWizard software package. You probably want to install it on a Windows computer, but there is also a experimental Docker image if you want to fiddle around with getting it to run well on Linux or Mac.
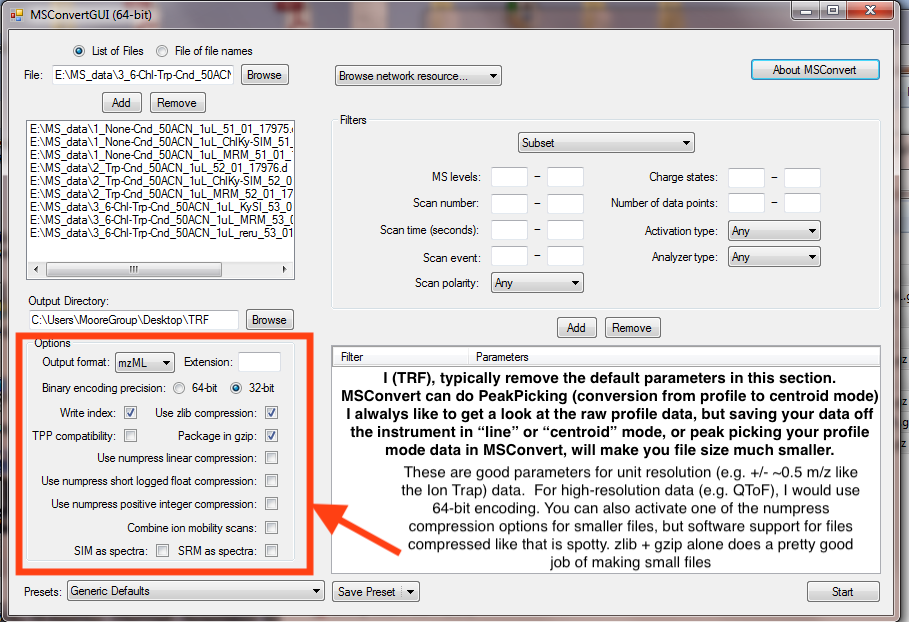
2. Setup MS Convert with your files, and the parameters. The parameters below should work well for Ion Trap data. If using high-resolution (e.g. QToF) data, select 64-bit instead.
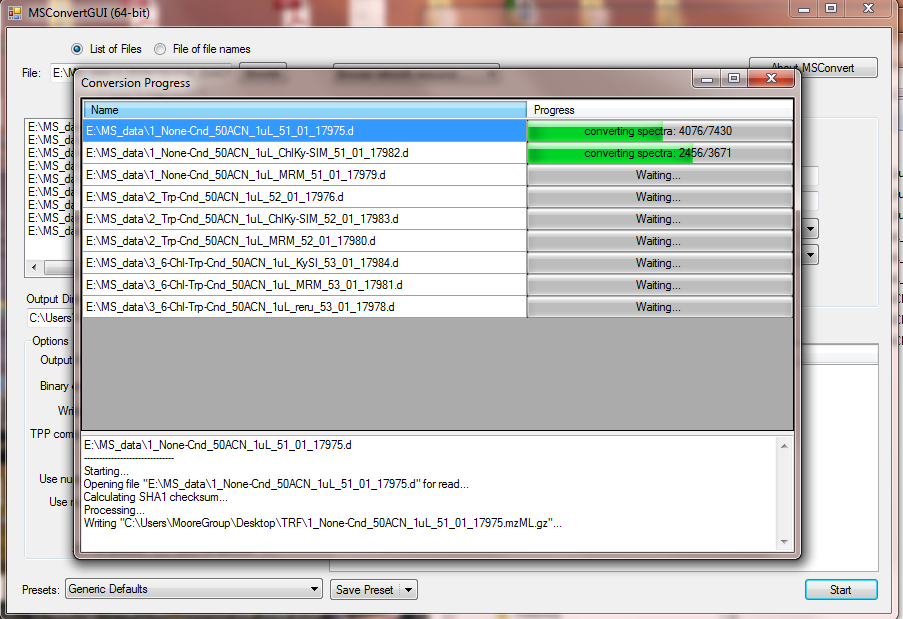
3. Wait for your data to convert to .mzML.gz format. Each file takes around 10 seconds.
4. Download, install, and open MZmine2. See the MZmine2 website for more details.
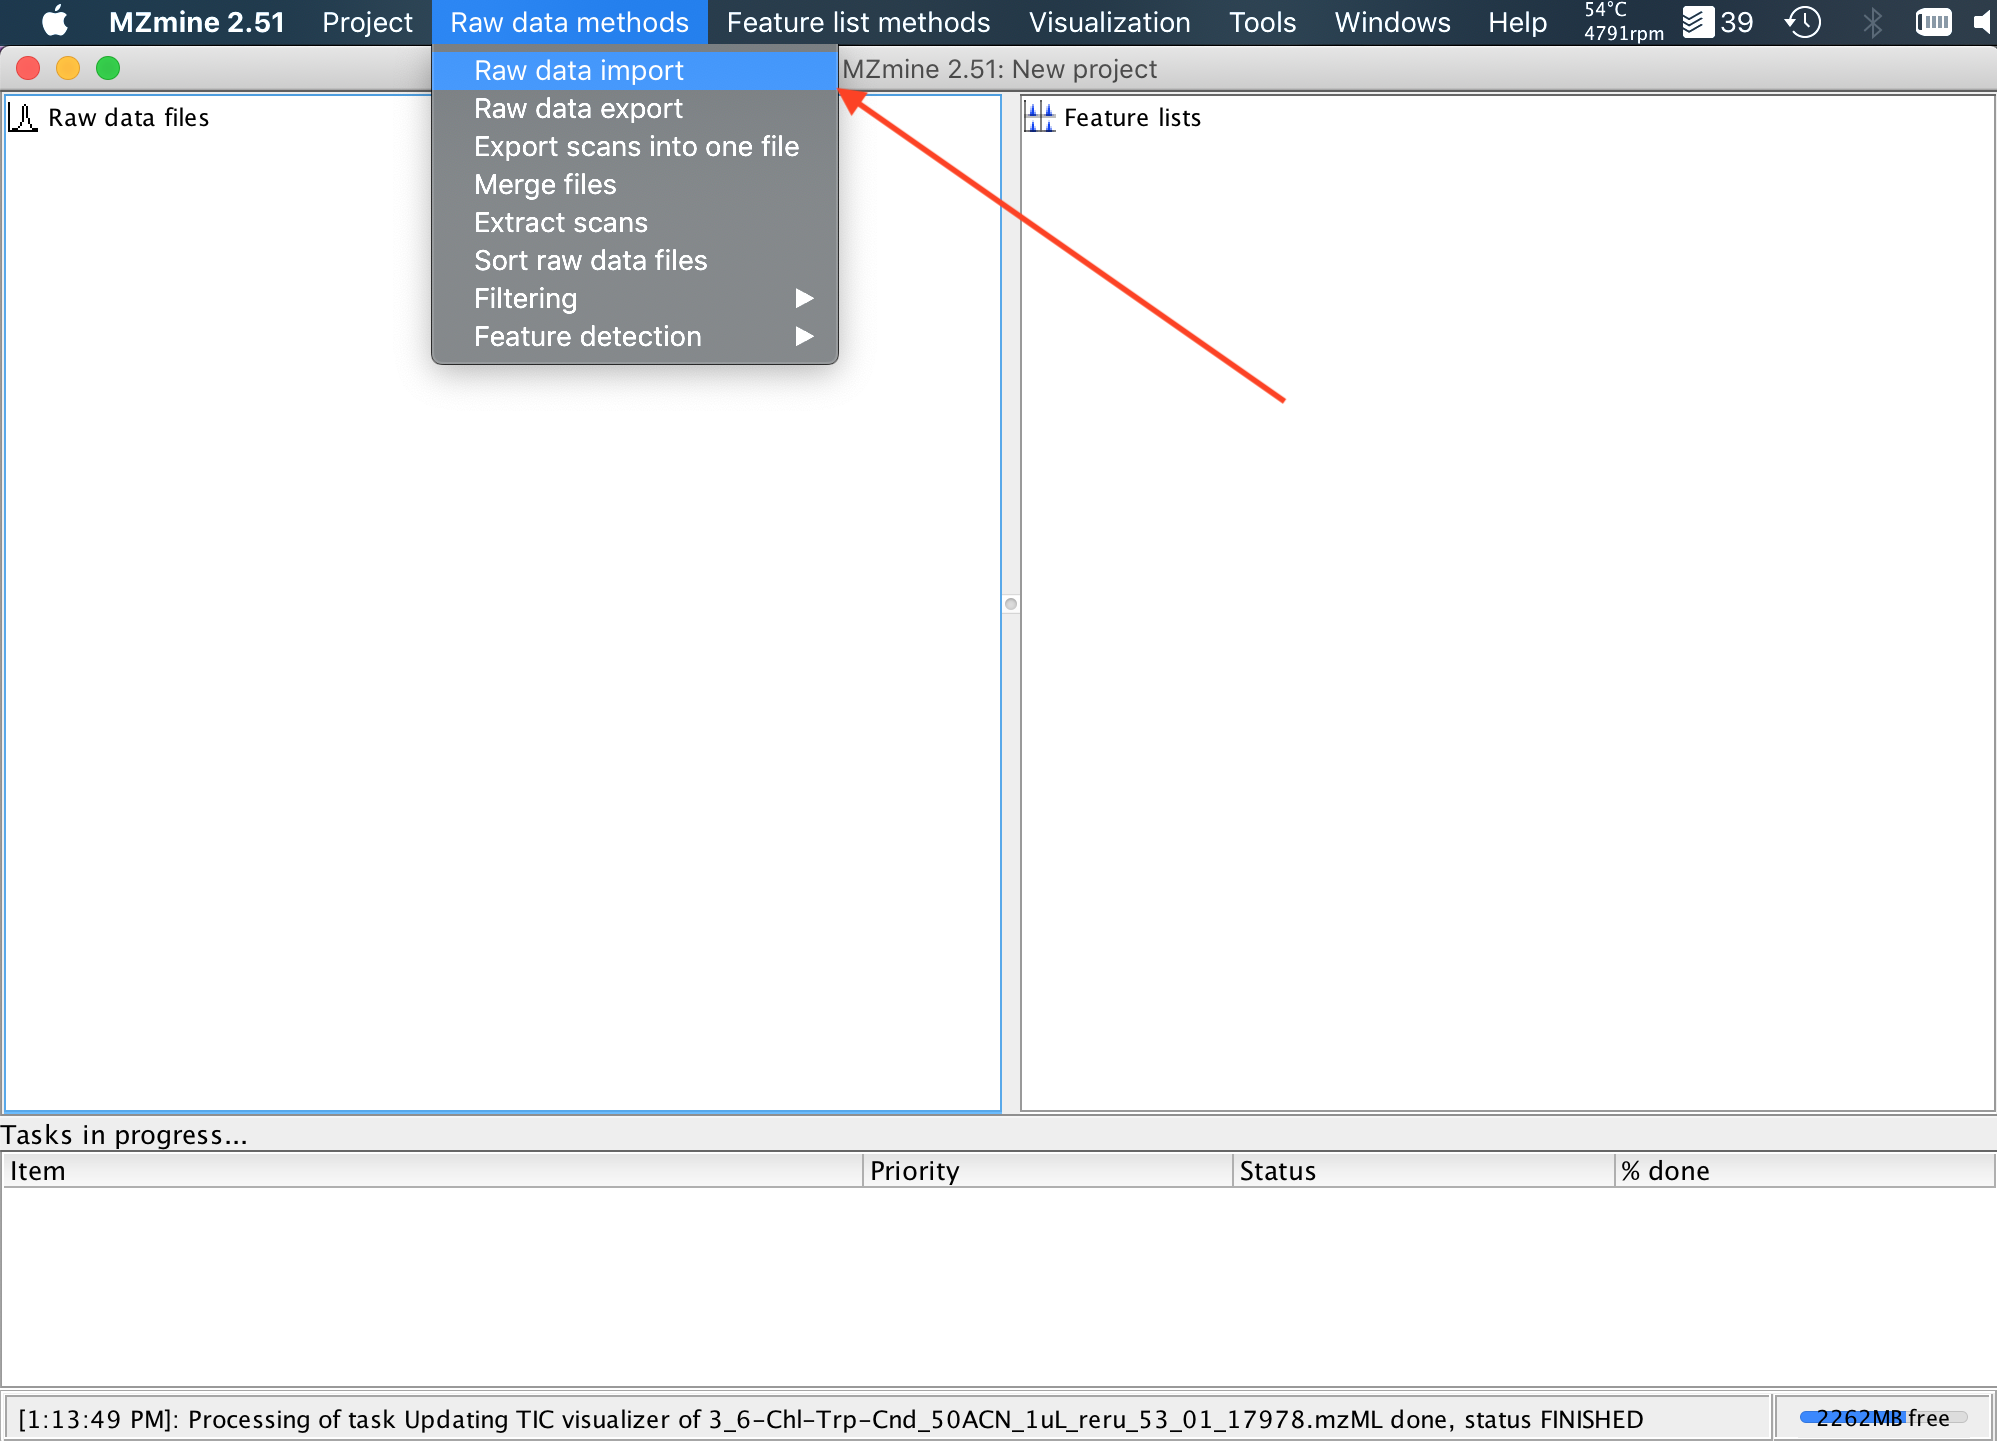
5. In MZMine2, import your previously generated .mzML.gz files, using the Raw data methods (Top menu)->Raw data import method (dropdown menu).
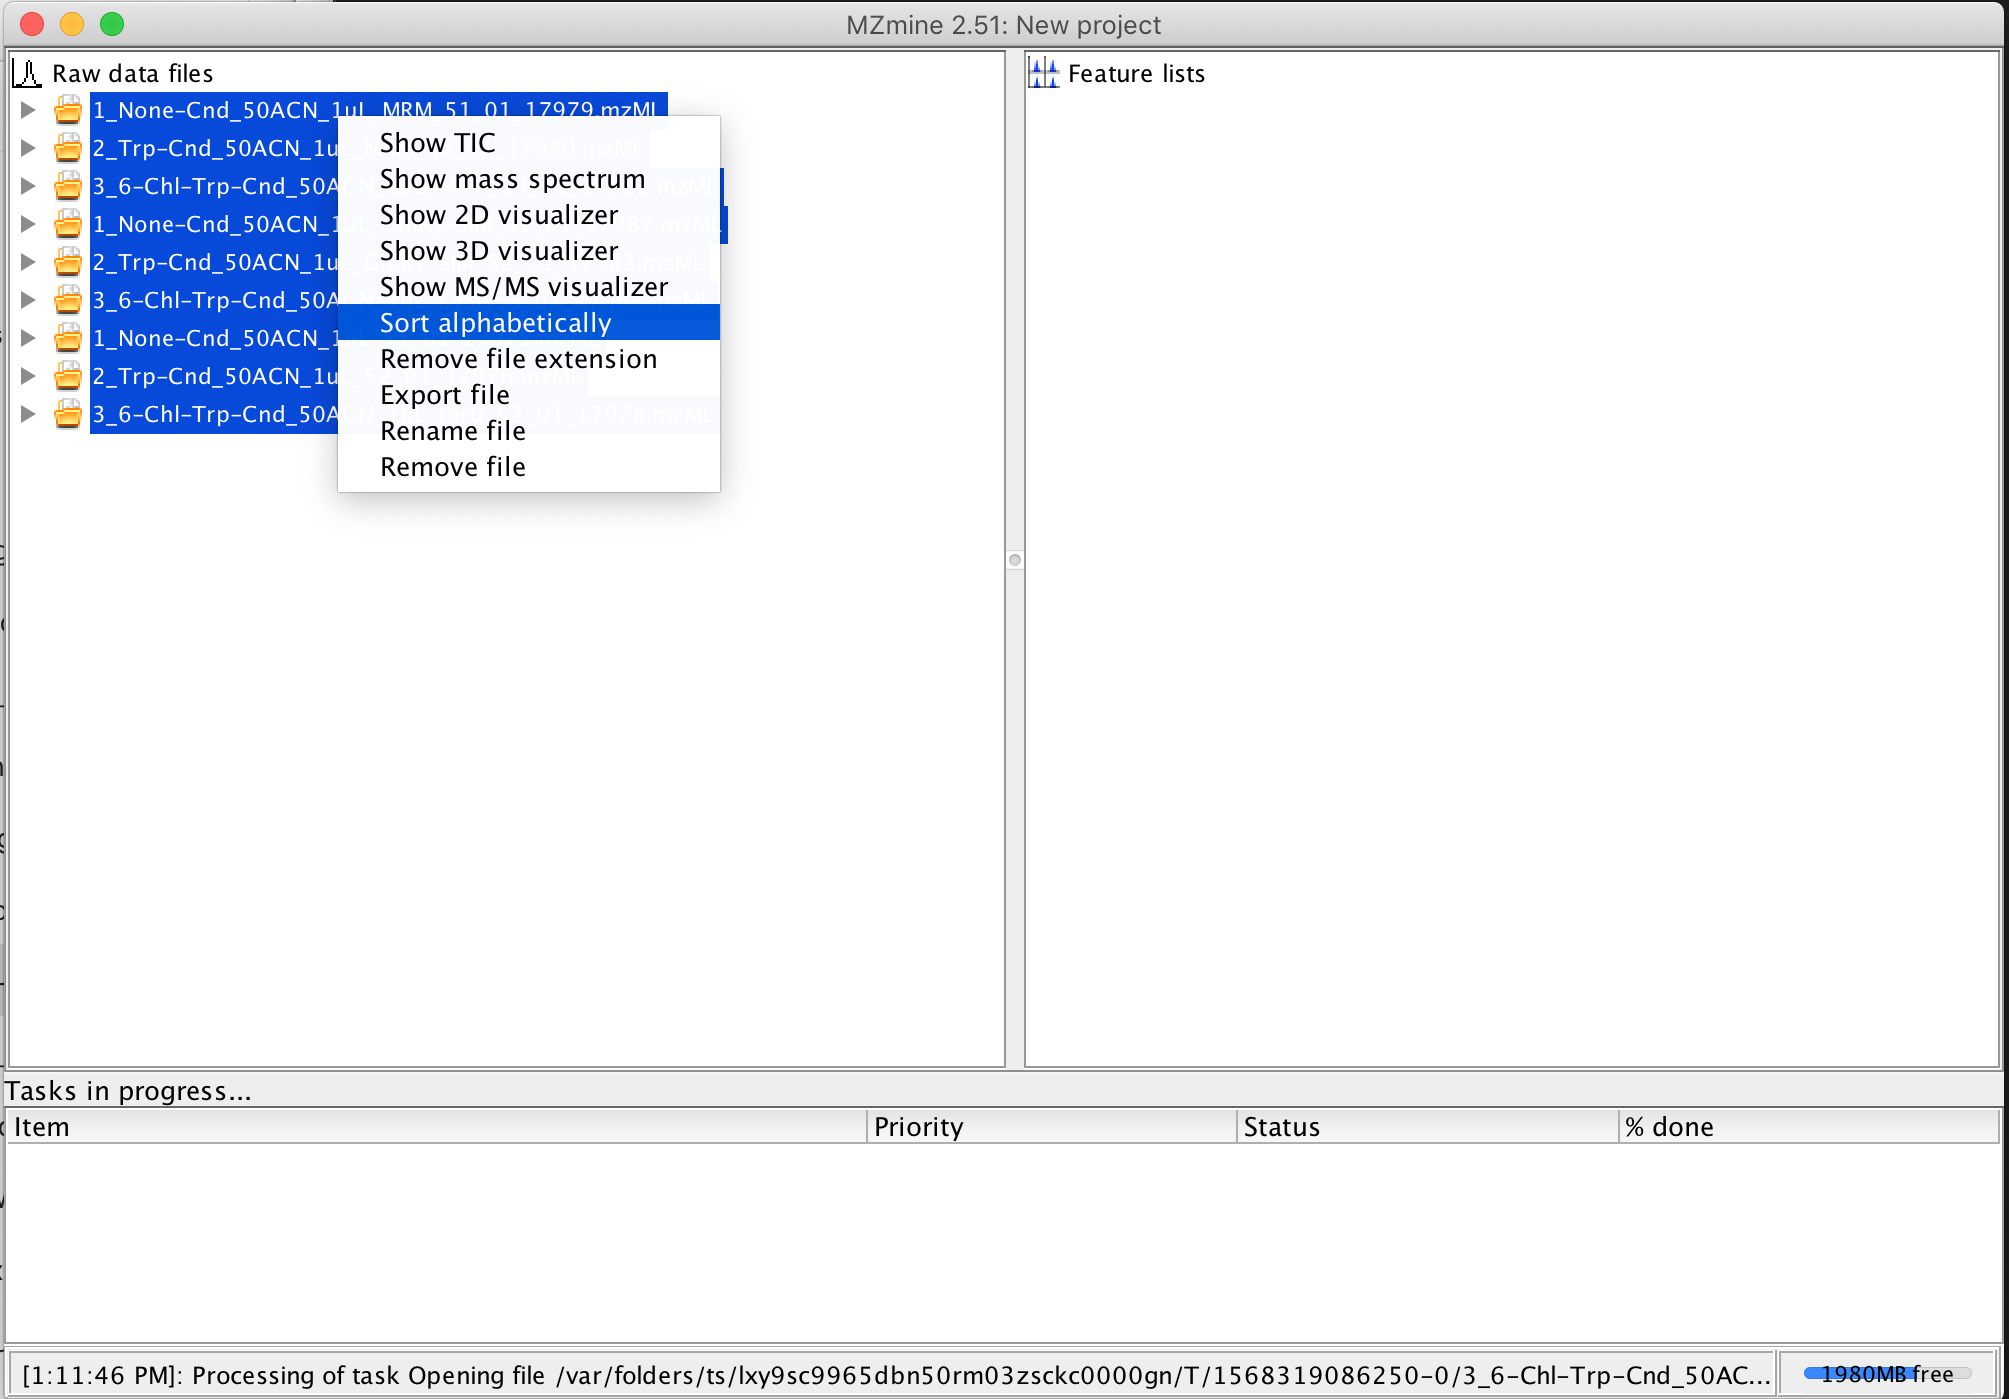
6. I find it convenient to sort the imported files alphabetically, since they get loaded in an undefined order. To sort the files, shift click the multiple imported raw files, to select them all, and then right-lick (or control-click on MacOS), and select Sort Alphabetically from the popup menu.
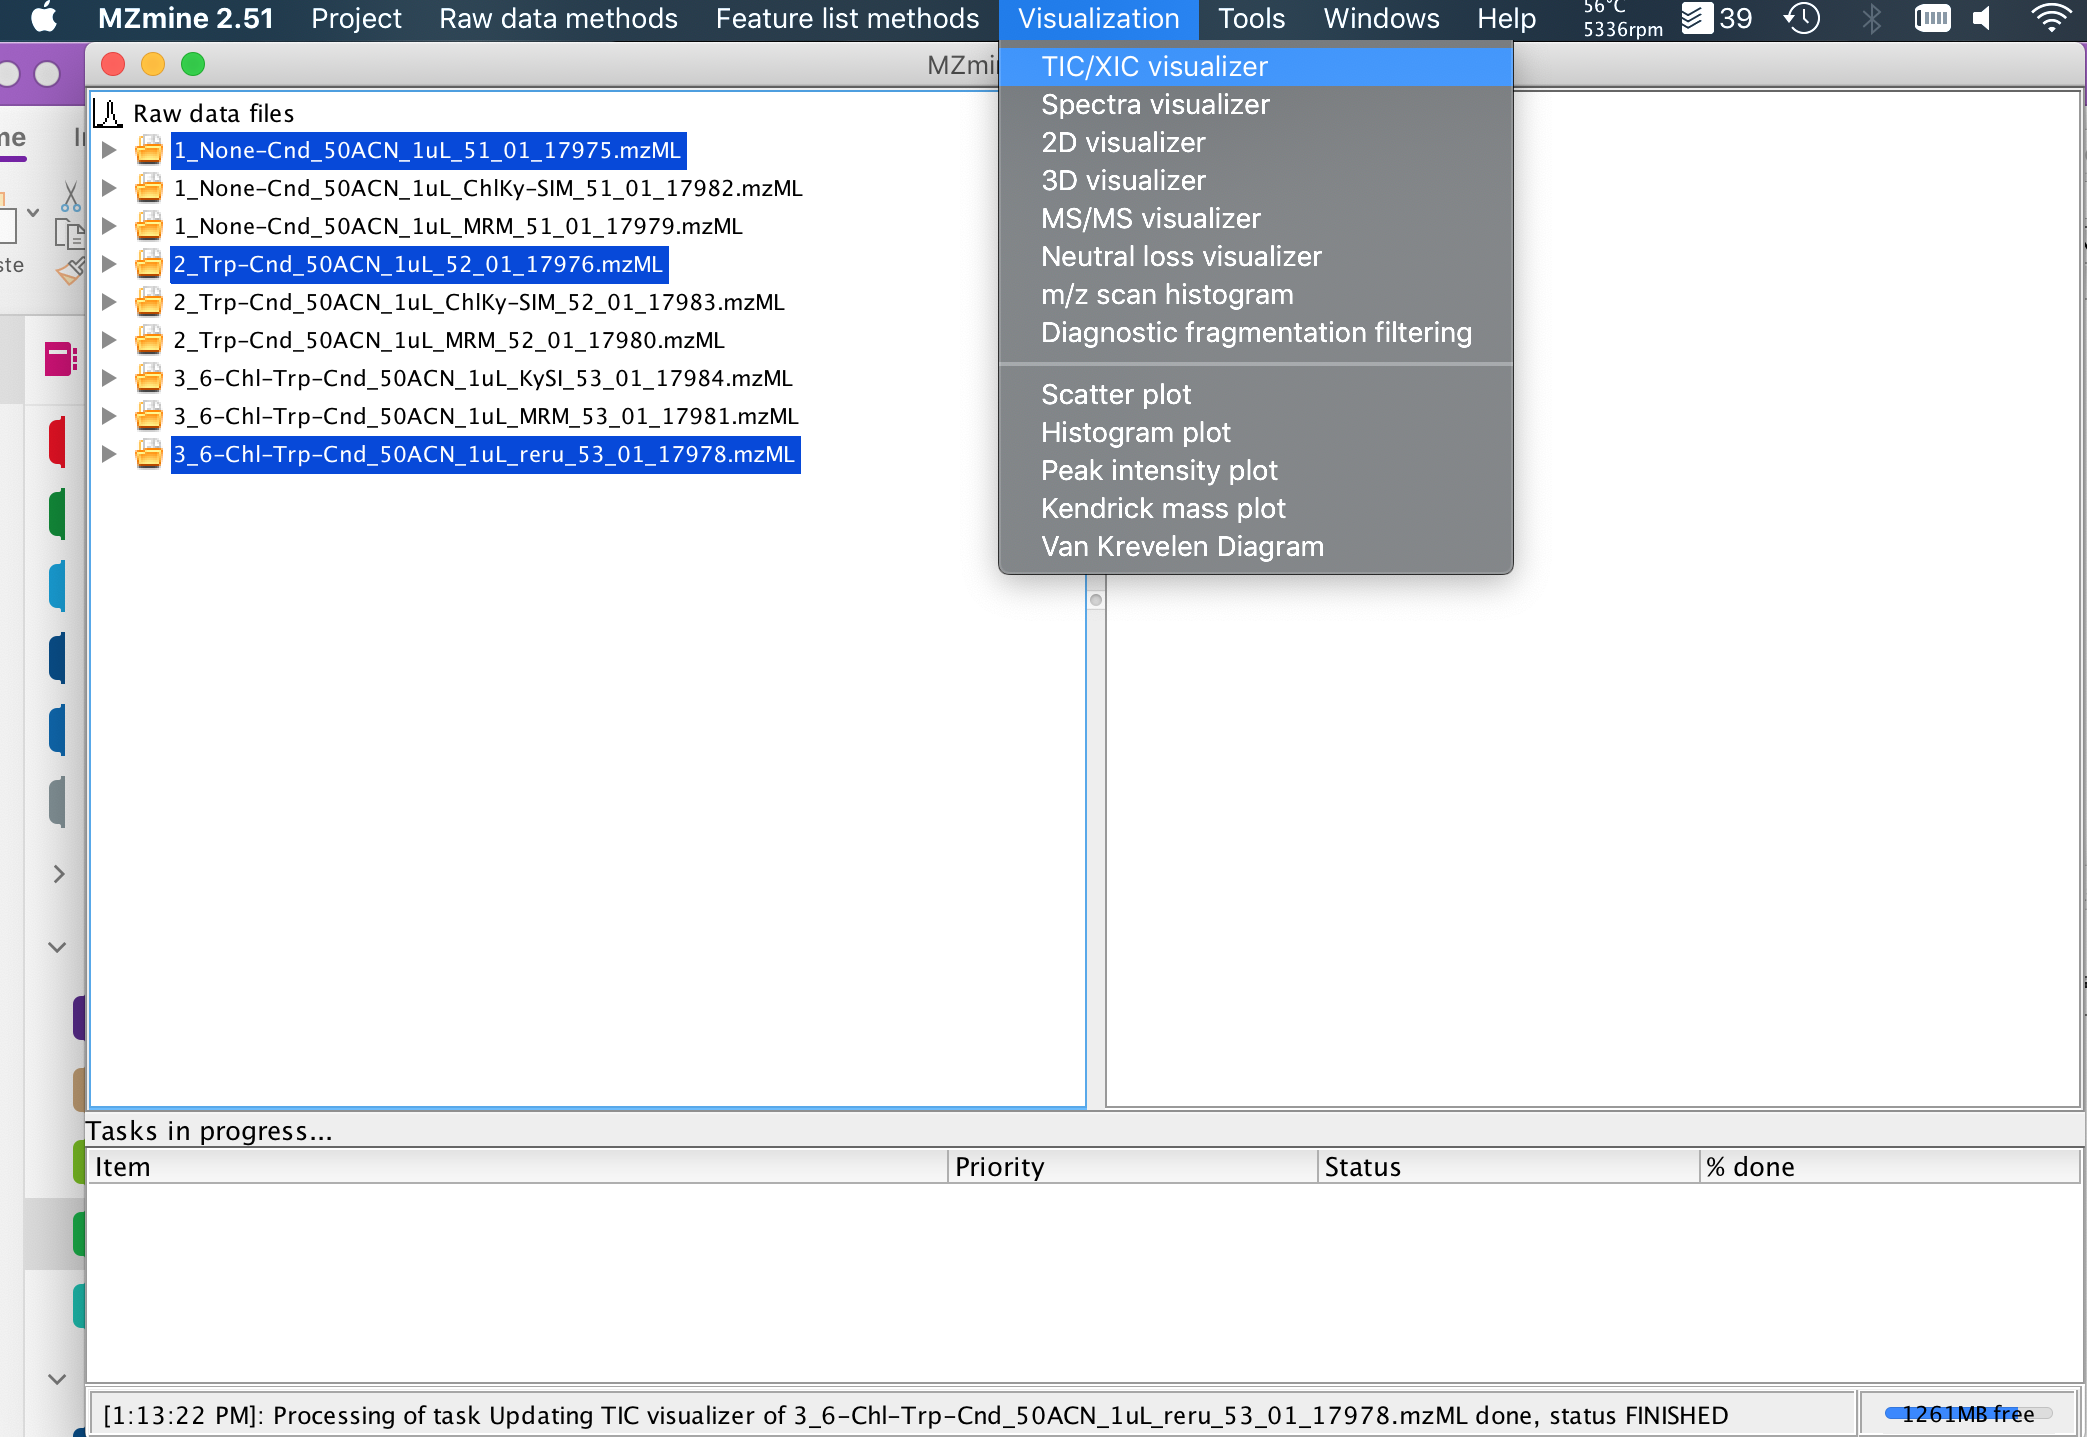
7. You can do a lot of data processing in MZmine2, including full untargeted metabolomics analyses & MS2 spectral networking, but for a first pass, you probably just want to make an extracted-ion-chromatogram (XIC, or EIC). Select the files you are interested in with shift, and click Visualization (Top Menu)->TIC/XIC visualizer (dropdown menu). In this case, I have selected 3 LC/MS runs with full scan (100-1000 m/z) MS1 data.
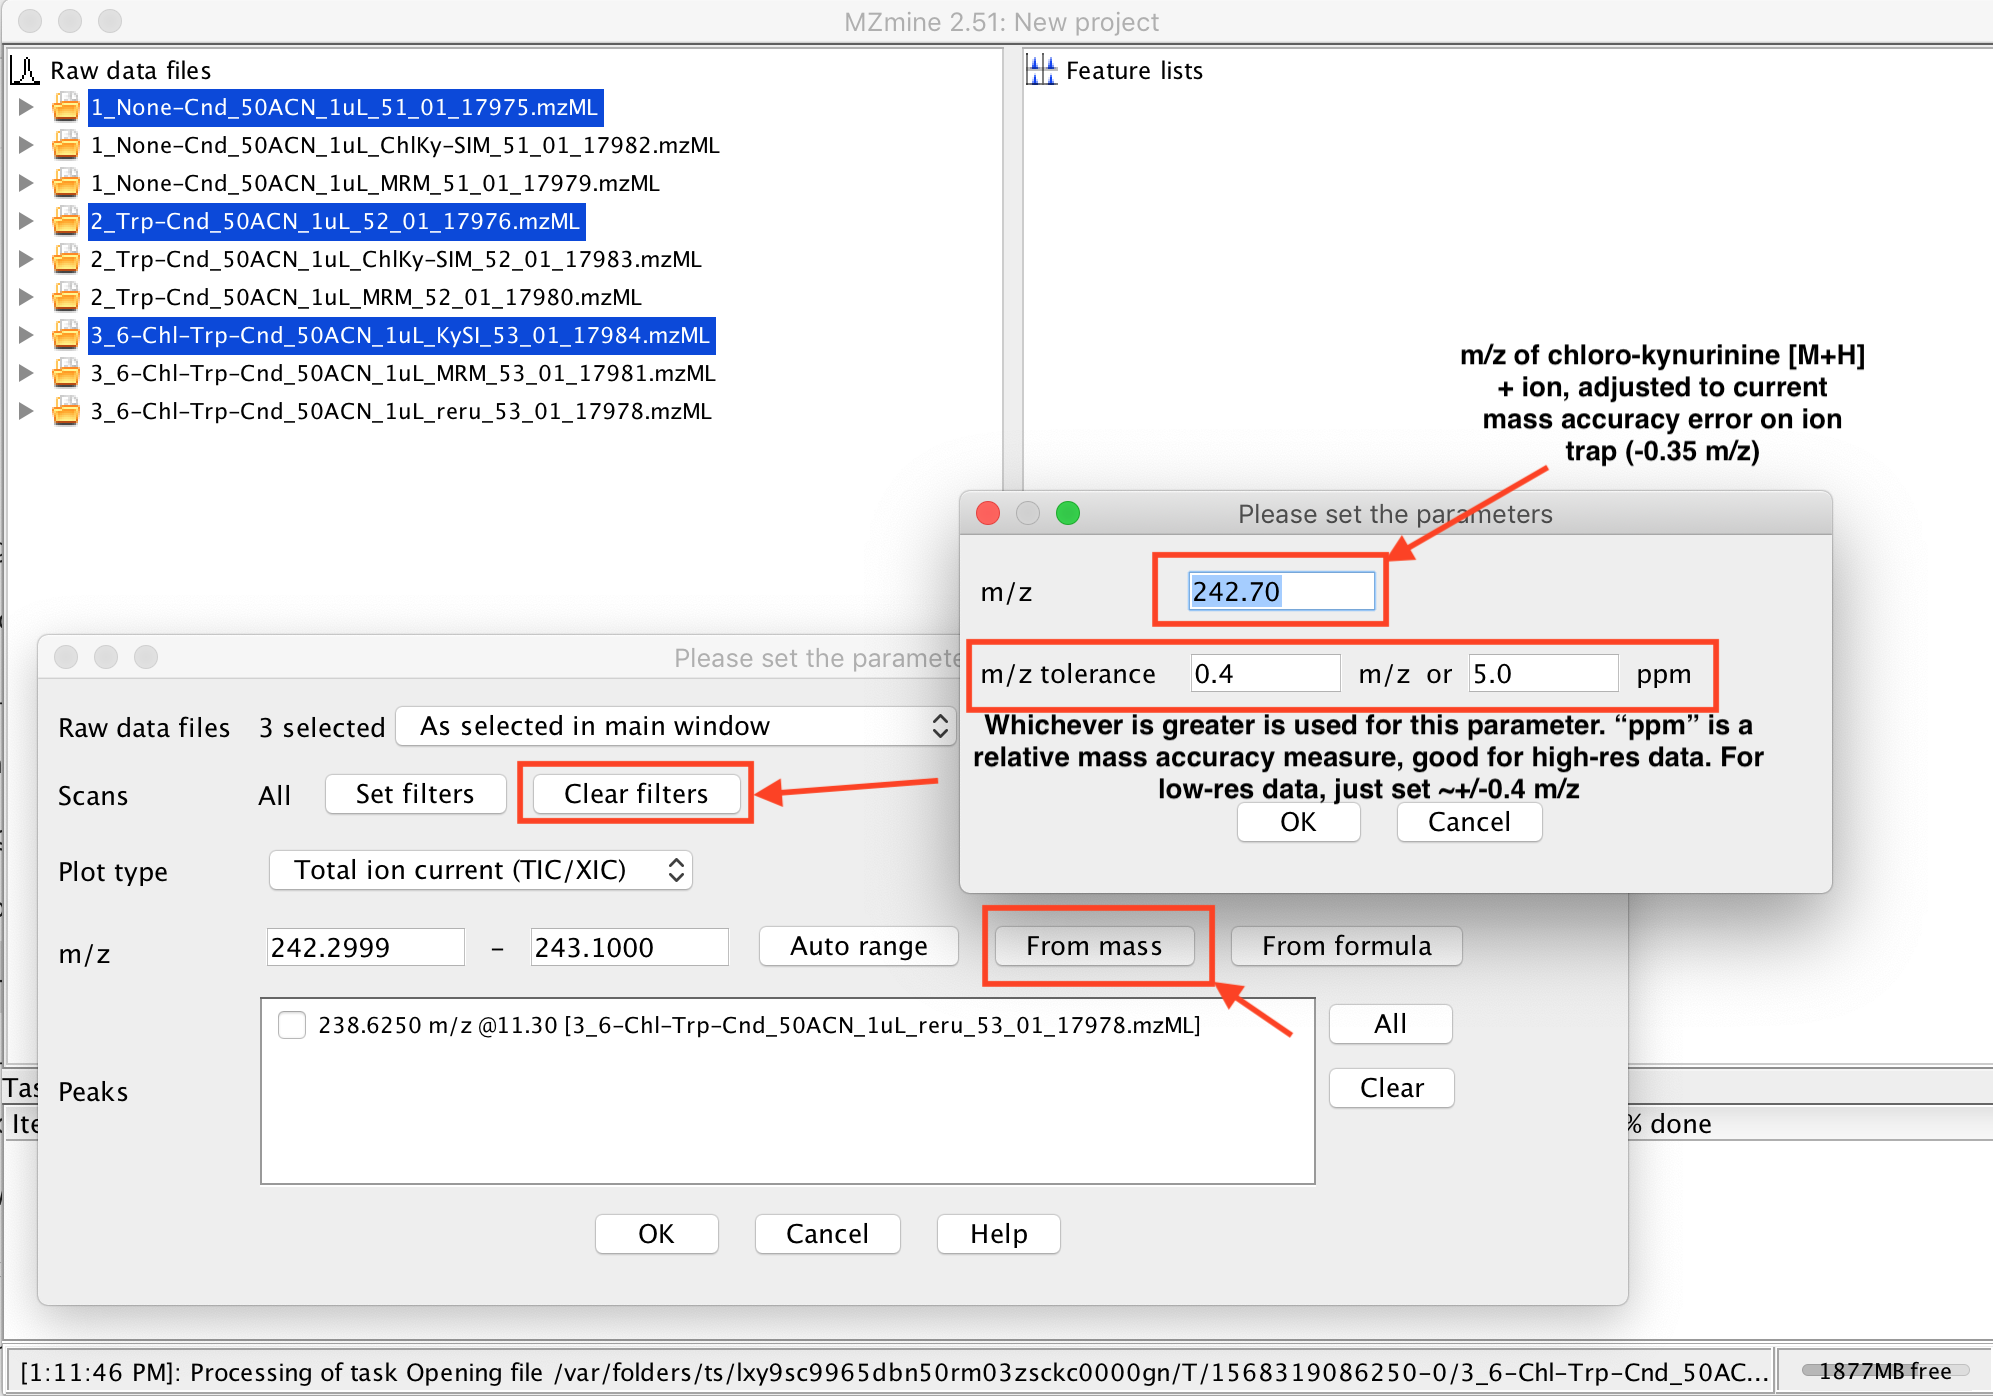
8. Next, tell MZmine2 which m/z you want to make an XIC for, by hitting the “From mass” button in the window that popped up. You may also want to click “Clear Filters”, as you possibly may not see your data with the default filters (e.g., it could be filtering to MS1 data only, but your data only has MS2 scans). Once the “From mass” parameters dialog pops up, you should set the expected center of your XIC window in the “m/z” box, and the width of the XIC window you want to see in the “m/z tolerance” boxes. This XIC module deals with the raw data, so it doesn’t make a lot of assumptions, unlike the assumptions in more involved downstream processing for computational metabolomics (e.g. you set your peak picking threshold too high, and the data you really care about was ignored)
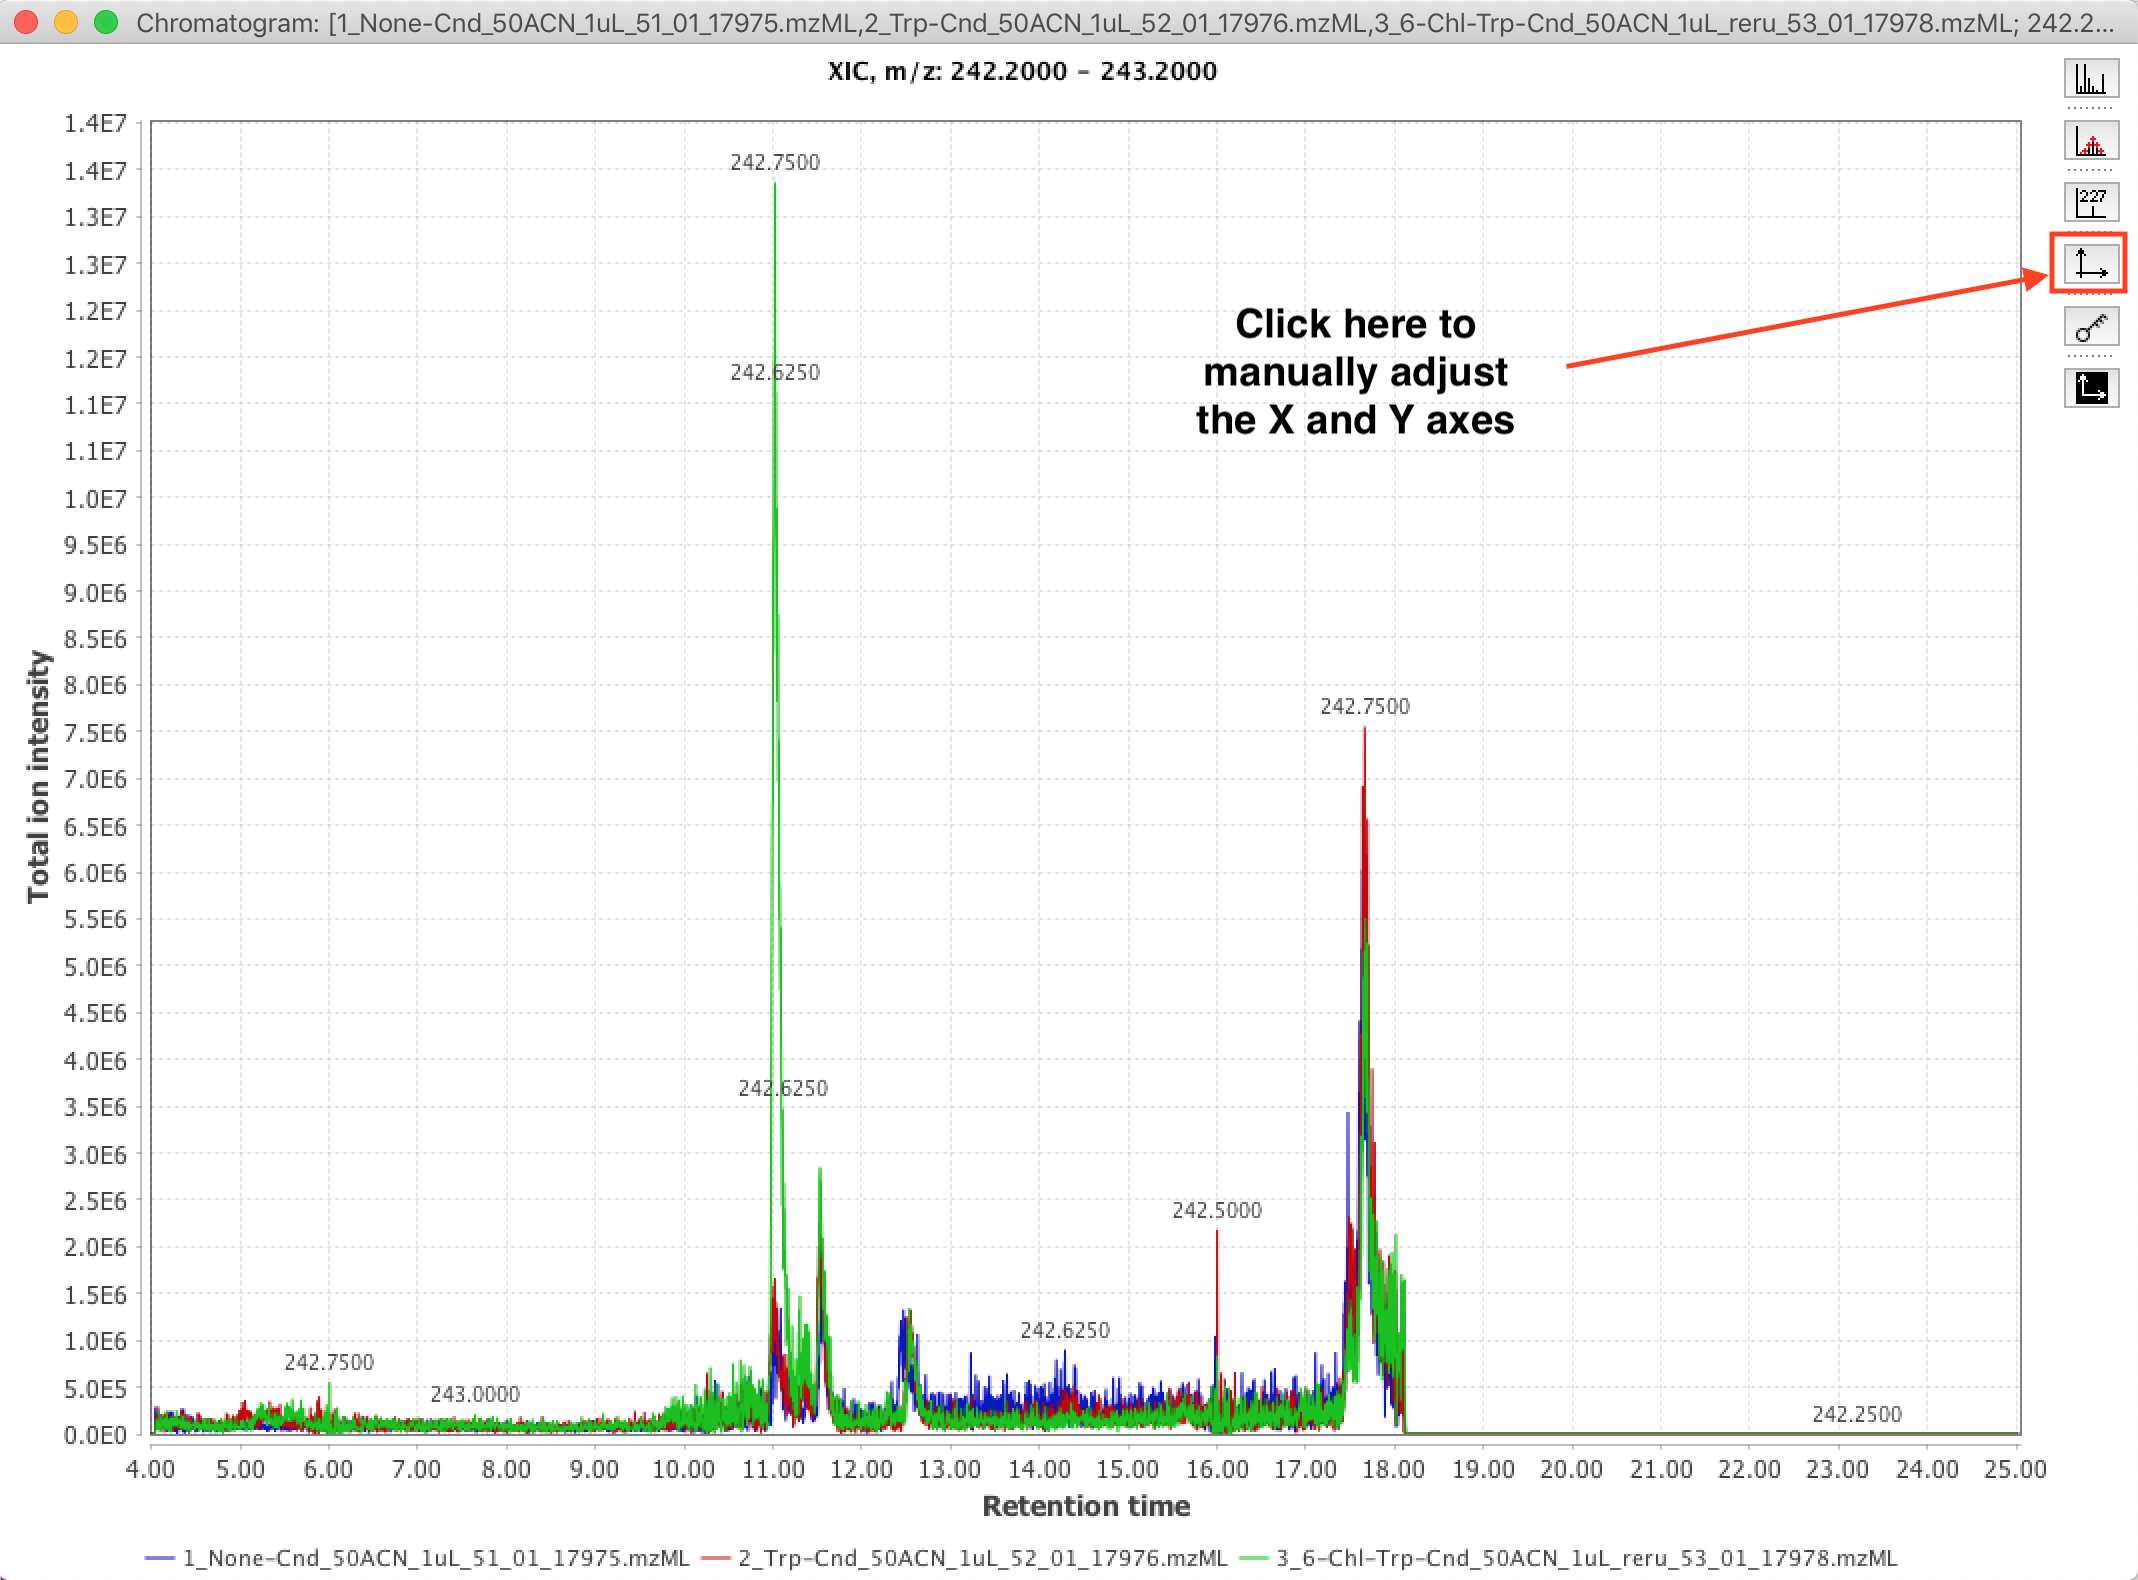
9. View the resulting XIC plot. Adjust the viewing window (aka, the range of the X and Y axes) by clicking and dragging a view box. If your viewbox gets screwed up, right-click (or control-click on Mac), and select “Auto range->Both Axes” from the popup menu. You can also manually set the minimum and maximum of the axes (e.g., you want all your figures to show 5-10 minutes in retention time), by clicking the “Setup range for axes” button, highlighted in the image below.
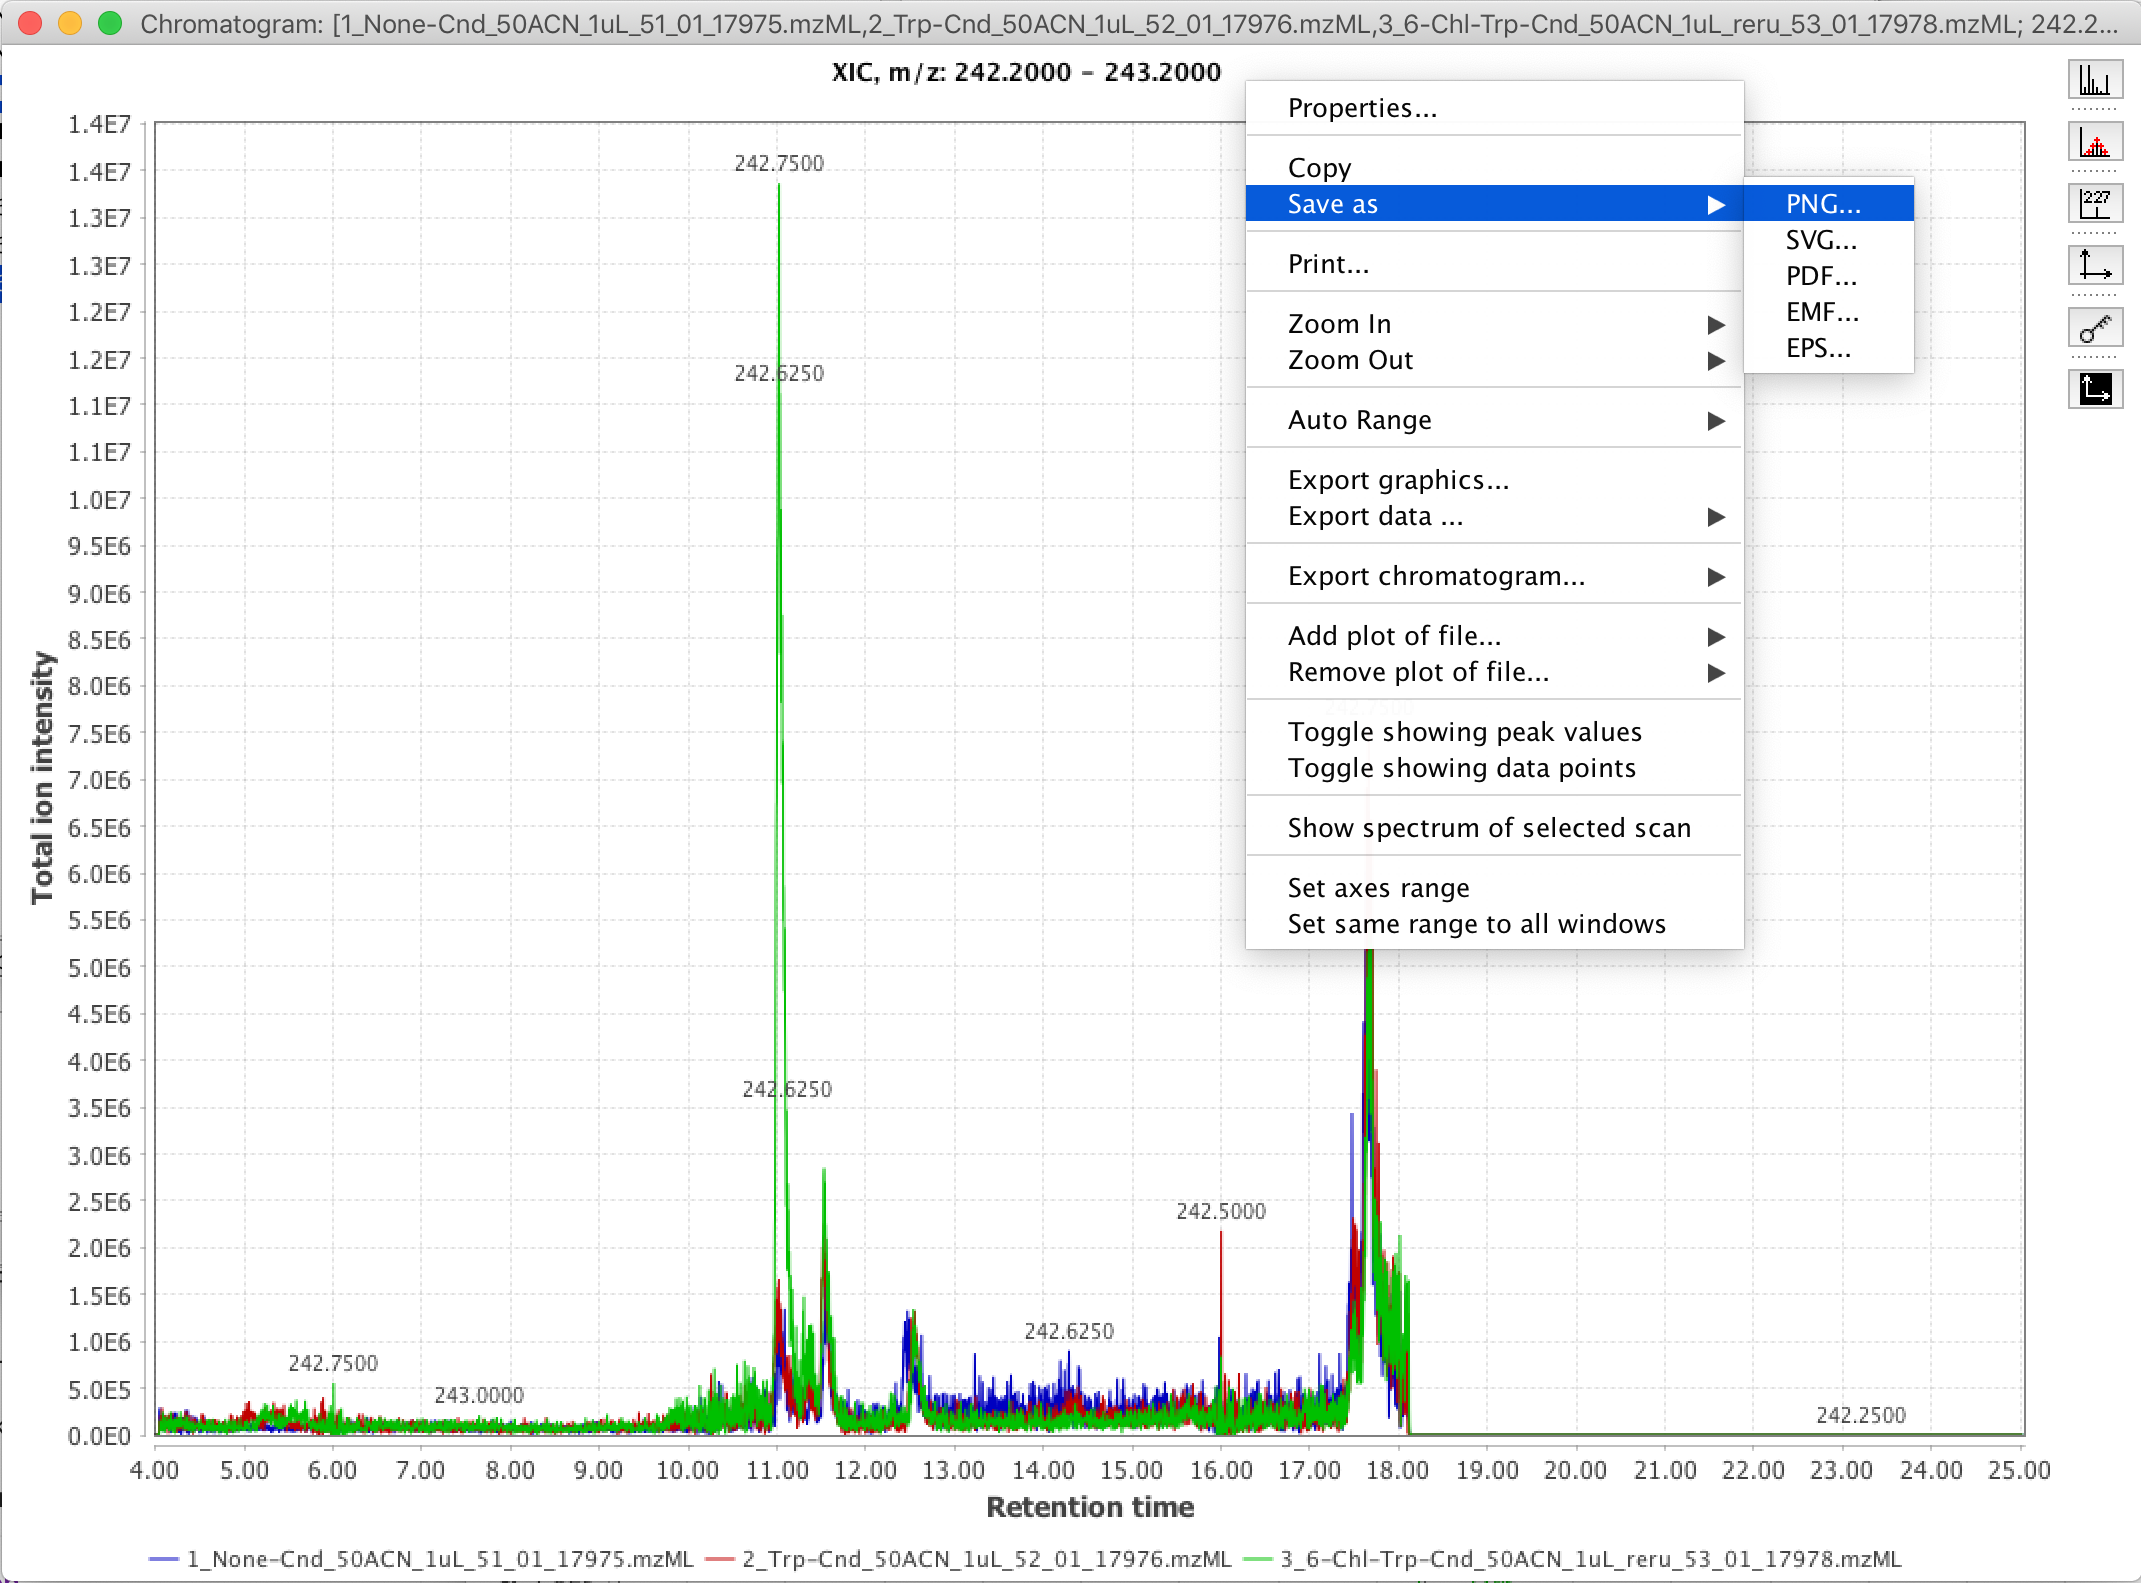
10. Export your figure by right-clicking (or control-clicking on MacOS) some whitespace in the viewing window. You can directly copy the figure in .PNG format to your computer’s system clipboard by selecting “Copy”. I personally find this “Copy” feature convenient for pasting the XIC figure right into my OneNote digital lab notebook. If you want to export the figure in a vector / editable format, e.g. for inclusion in a paper, you can select the “Save as” option, and save the figure in a variety of vector formats (e.g. .SVG, .PDF, .EPS)
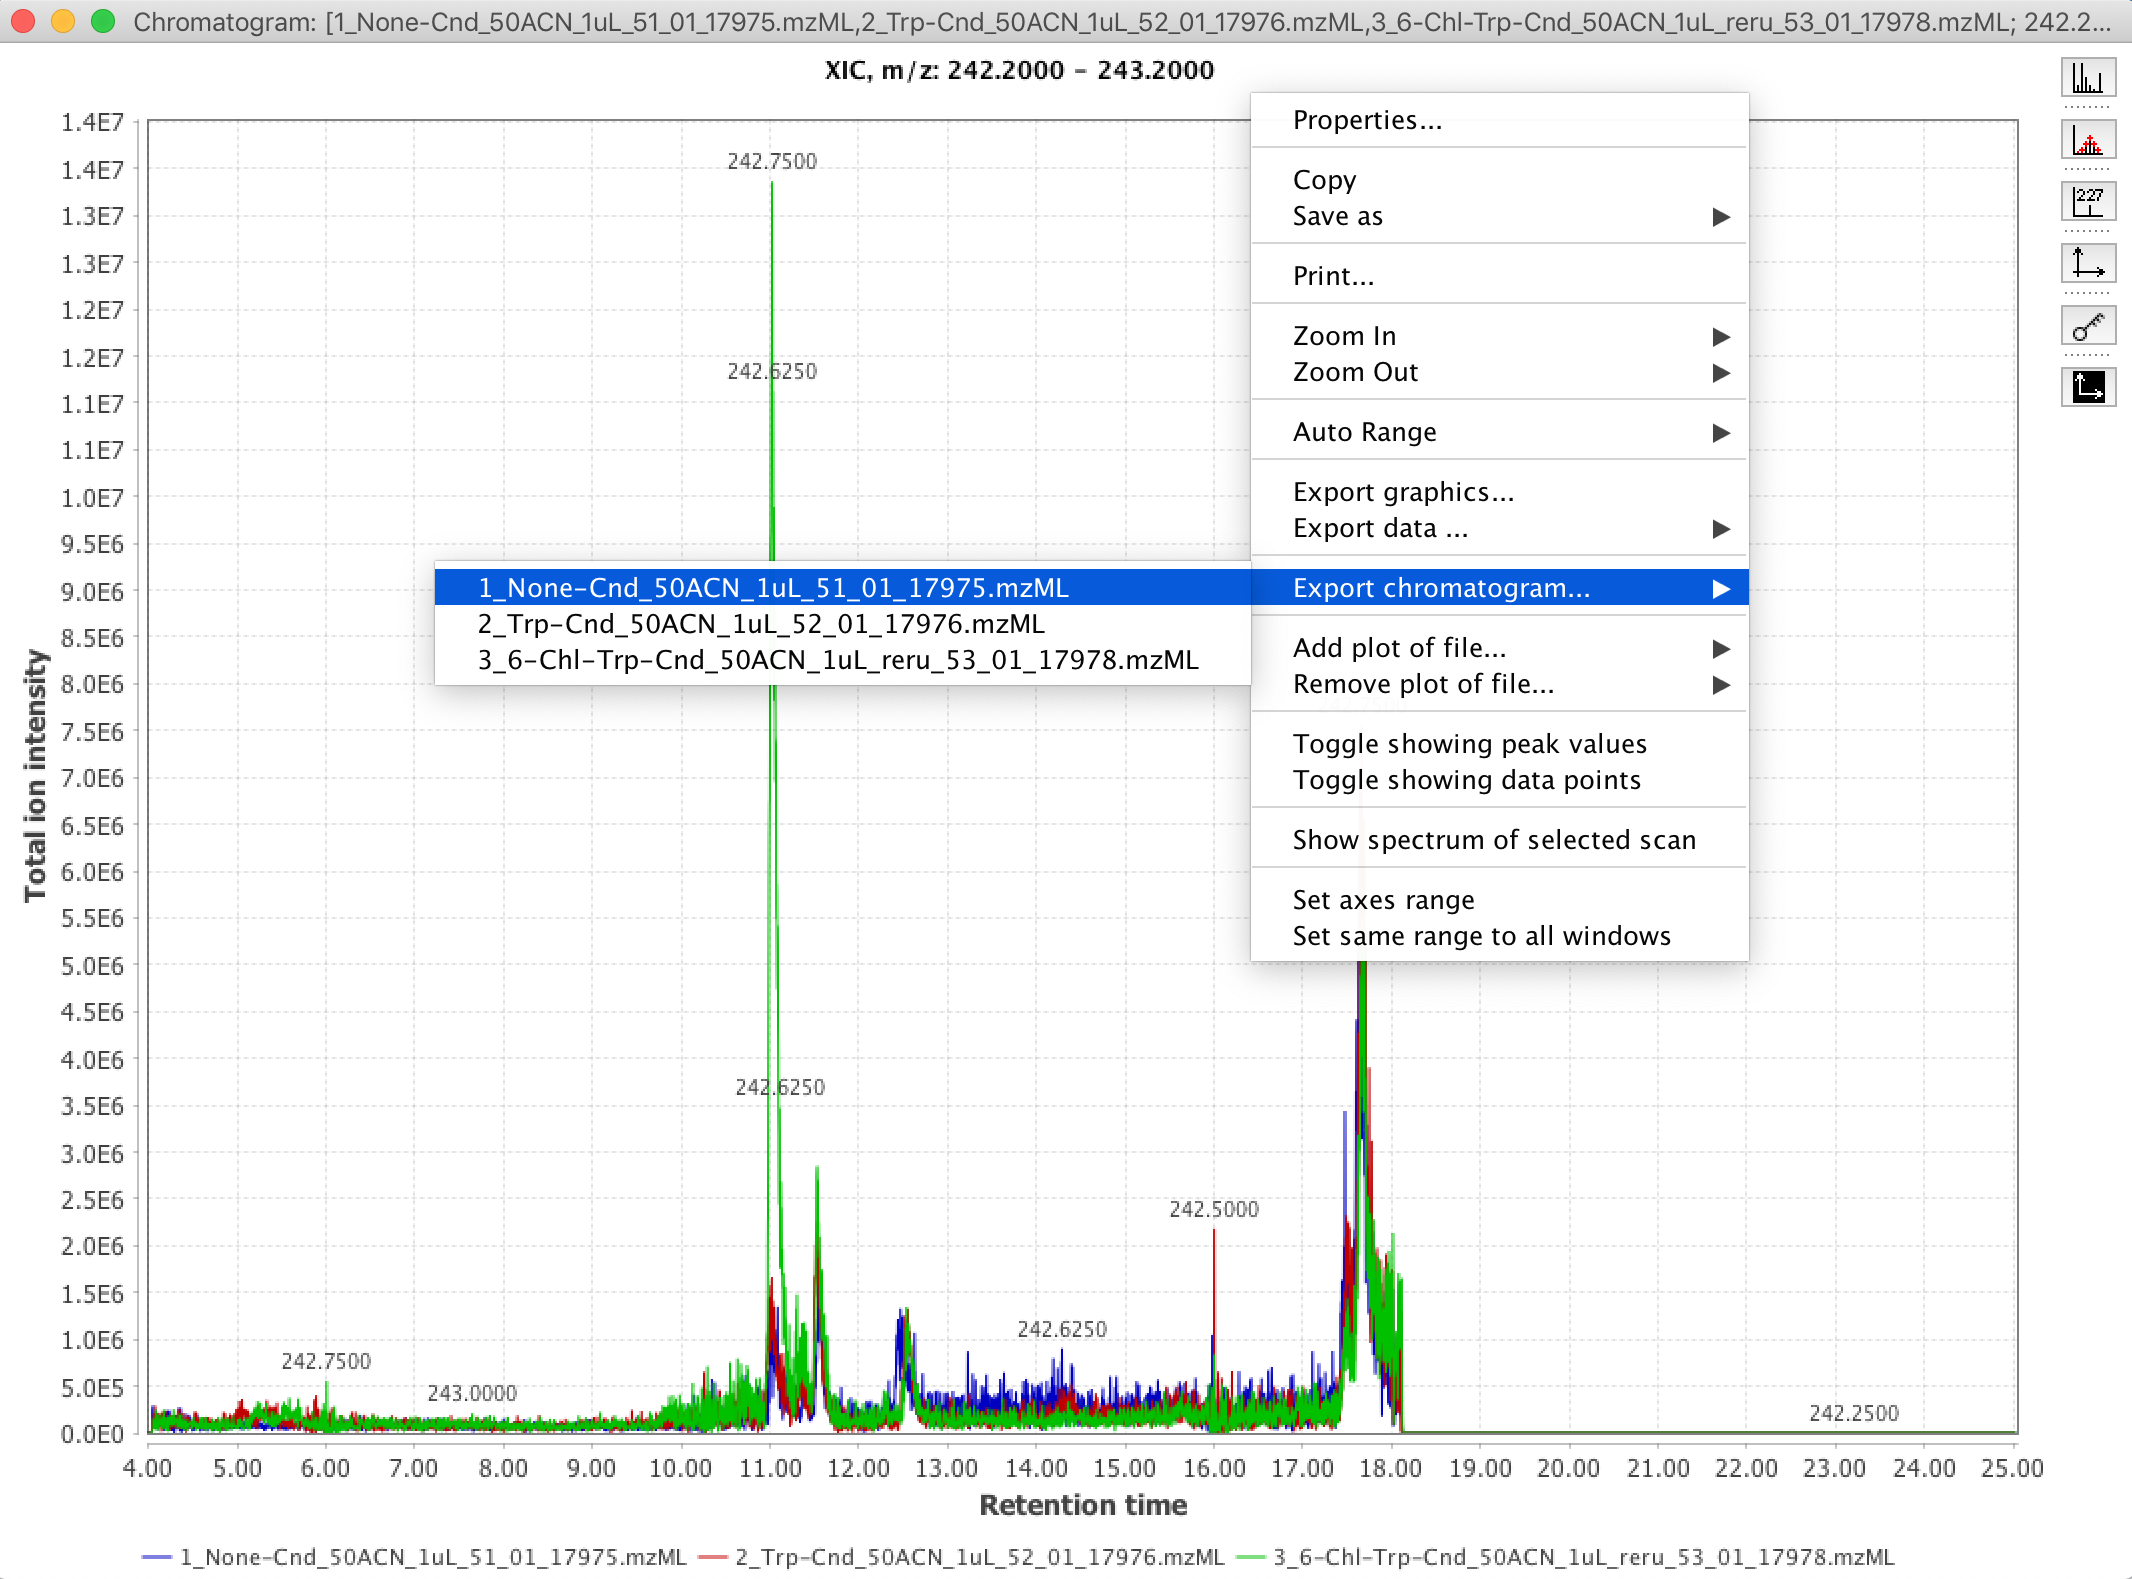
11. You can also export the intensity & retention time value-pairs of the chromatogram data into comma-separated-values “.csv” format, suitable for import into generic spreadsheet and plotting software (e.g. Microsoft Excel). To do that, right-click (or control-click on MacOS) the whitespace of the XIC viewing window, and select the “Export chromatogram” option.
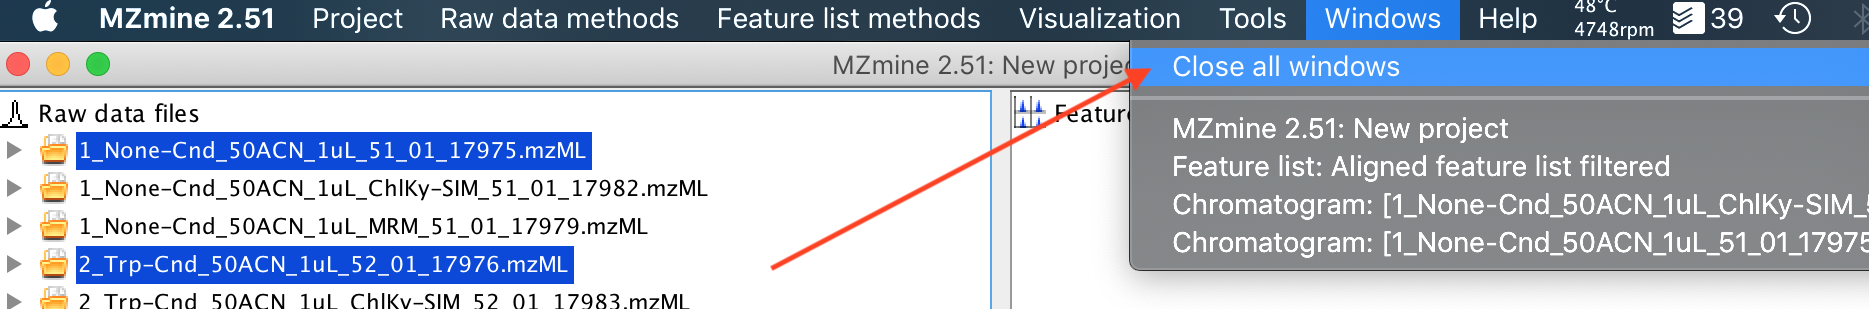
12. Hopefully that gets you started with making simple figures using MZmine2. But a quick hint: The window management of MZmine2 is a little crazy. After doing a long analysis, you might find that you have 20+ windows open, and closing them all is kind of a pain. The Windows (top menu)->Close all windows (Dropdown menu) operation, is a great trick, which closes everything except for the base project window, so you are left with all your raw and processed data, without any extraneous analysis windows that may be clogging your screen up.