How far east does the firefly go?
on Blog, Gis, Ecology
As a wise biologist once said, maps are useful1.
With that rationale in mind, in 2017 my collaborator Dr. Sarah Lower and I began our efforts to produce an updated map of the geographic distribution of Photinus pyralis (the Big Dipper Firefly - most commonly seen firefly in the USA). I’ve reproduced the map we came up with below:
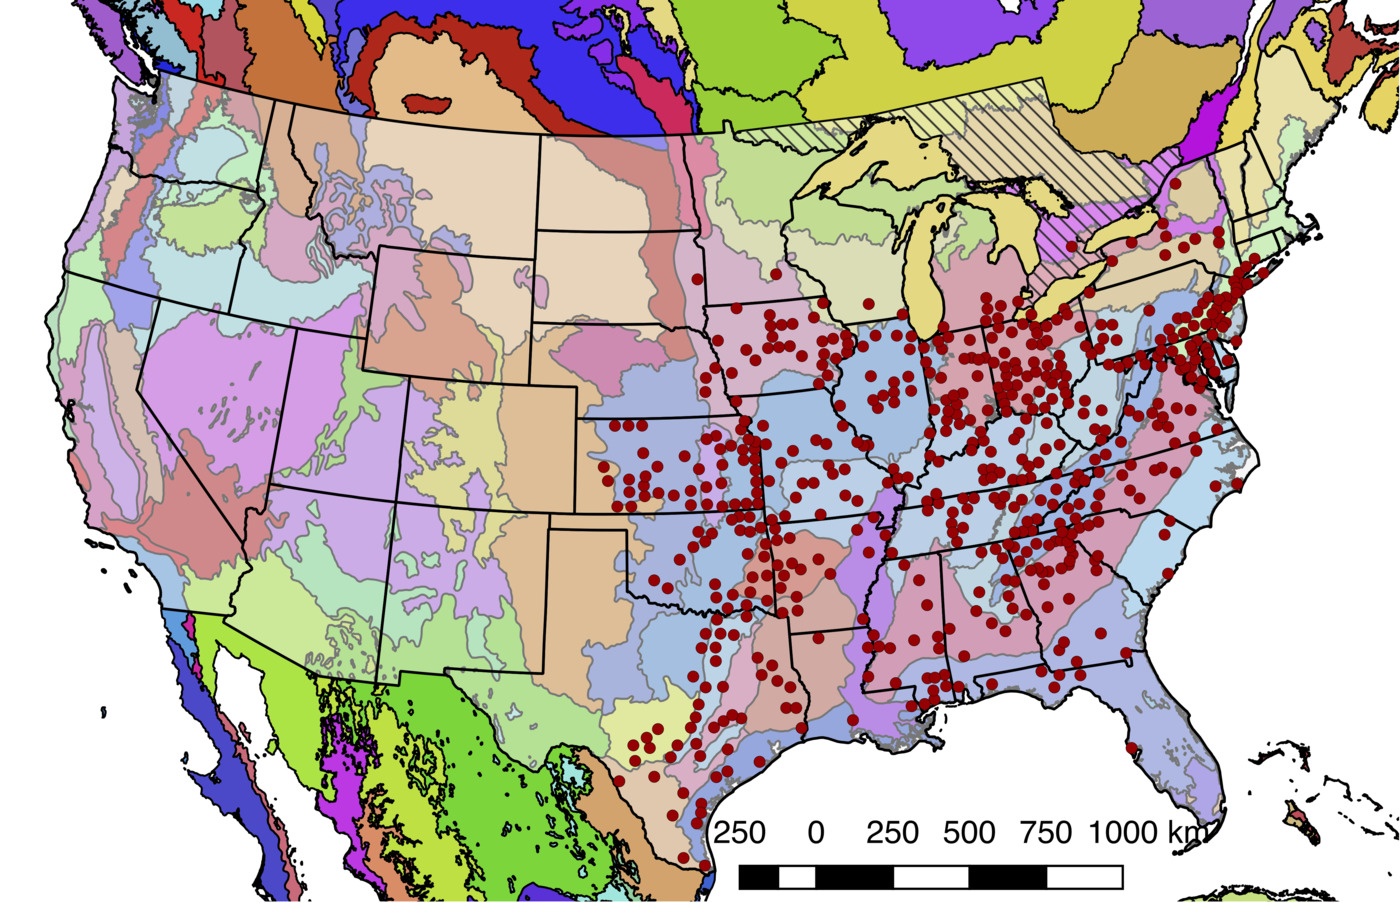 Figure 1. Detailed geographic distribution map for the Big Dipper Firefly (Photinus pyralis). Photinus pyralis sightings (red circles show county centroided reports) in the United States and Ontario, Canada (diagonal hashes). The World Wildlife Fund Terrestrial Ecoregions are also shown (colored shapes).
We reported this map, plus the details of how we made it, in the supplementary information of our recent manuscript on the sequencing of the Photinus pyralis, Aquatica lateralis, and Ignelater luminosus genomes.
Prior to our updated mapping effort, the de facto maps of P. pyralis and many other Photinus firefly species were/are from Dr. Jim Lloyd’s fantastic 1966 monograph on the biology of Photinus fireflies2. Critically, Dr. Lloyd’s manuscript reported no P. pyralis sightings east of New York state. (Unfortunately for me, that means I had to drive 5 hours from MIT to New Jersey to collect them for my research)
Our updated P. pyralis map is mostly made from Dr. Lloyd’s extensive dataset that he kindly provided to us and had continued to expand since 1966 (over 500 sightings!). But thanks to a research collaboration at Yale (New Haven, CT) over Summer 2017, I actually had the opportunity to do some firefly field surveys myself and contribute sightings to the map. Over about a week of working at the bench at Yale during the day, pre-sunset driving to firefly field sites throughout Western Connecticut, observing and recording the presence or absence of P. pyralis around sunset, camping nearby overnight, and then driving back to New Haven the next morning to continue bench research (a lot of work!), to my surprise and delight I found that Big Dipper fireflies were in abundance at all the sites I visited in Western Connecticut, at least as far east as New Haven.
This eastern extension of the known geographic range of P. pyralis fireflies well into Connecticut, was great information, potentially saving me several hours of driving off future firefly collection trips, but I was still left with a burning question…
How far east does the firefly go?
The question of where the edge of the geographic range for a species falls is both a bit ephemeral, and concrete. It is empemheral because the edge of the species range is always moving based on movement of individuals, or on year-to-year variation in climate or ecological conditions which prune-back or expand a population. But the species range is also concrete because there is a real edge at any given time.
A trivial answer to the question of how far east fireflies go in the USA is: all the way east, which is to say, many Photinus, Photuris, Pyractomena, Lucidota, and Ellychnia genus fireflies are found throughout Massachusetts, and into Maine (and beyond).
But, those fireflies aren’t ‘the firefly’, by which of course I mean my favorite species, Photinus pyralis.
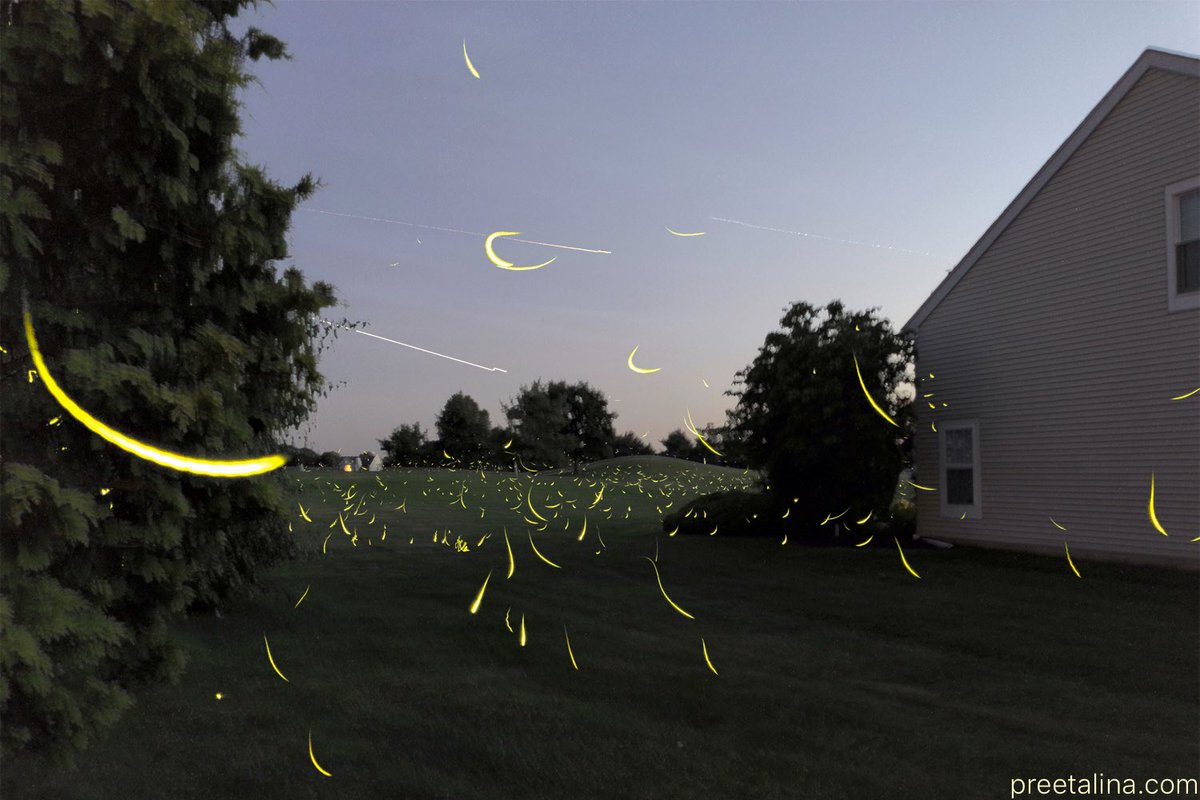 A great time-lapse photo showing the “upwards J” flash pattern characteristic to P. pyralis. Photo Credit: Preeti Desai via Twitter.
As for the question of how far (north)east the P. pyralis population goes, in a discussion via Twitter, @galos_gann kicked off this blog post deep dive by reporting that he hadn’t seen any P. pyralis in Rumsford, Rhode Island in early July of 2018.
As it turns out, I also hadn’t seen any P. pyralis in a visit to a promising firefly field site in western Rhode Island in Summer of 2017, so had to wonder: What gives? Does that mean there aren’t P. pyralis in Rhode Island? It seems a bit odd given that New Haven (having P. pyralis) and Rhode Island are pretty close and quite similar in terms of their climate and ecosystems. I formulated a hypothesis to explain this possible discrepancy:
The northeastern extent of the Photinus pyralis species range is constrained by climactic conditions. Rhode Island and New Haven, while they might seem similar, are climatically different enough by firefly standards that P. pyralis can’t survive well in RI
For this blog post, I’ll attempt to take a first step to test this hypothesis, by combining the data we have on the P. pyralis geographic distribution with an exploratory GIS analyses of a key climactic criteria that I think limits the geographic distribution of P. pyralis: the average minimum temperature over the winter.
Part 1: Setting the GIS stage
If you’ve never heard of GIS, consider this a very basic crash course. GIS stands for geographic information system, and they are the software tools intended to help manage and manipulate any type of data that references real geography in some way (e.g. data points, associated with GPS coordinates). Being a computationally minded biologist who studies organisms that live in the real world, I thought learning GIS to produce a firefly geographic distribution map would be a useful endeavor. I’ll now try and share some of my knowledge to get you started with GIS:
First, you need to download and work with a GIS application, such as my personal favorite, the free and open source QGIS. After opening QGIS, you get a totally blank map, which can be a bit disheartening (or exhilarating, depending on your perspective). To get the basics on there, such as landmasses and national borders, here are two GIS data sources I’d recommend starting with:
- US Census Bureau Cartographic Boundary Shapefiles Your one stop shop for USA boundary related things. States, counties, cites and much more!
- Natural Earth Great resource for basic mapping elements from around the globe
From these sources, you’re looking for a “Shapefile” to import into your GIS app. Shapefiles are some impromptu binary format that has become a standard in the GIS field, so if some entity (city government, national governments etc.) is releasing GIS data, it is usually in this format. Googling for “THINGYOUWANT GIS shapefile”, usually turns up what you need.
To start, I’ll import the US Census shapefile of state boundaries, (QGIS menubar -> Layer -> Add Layer -> Add Vector Layer - the .shp file is the one you want to import) and plot it using QGIS:
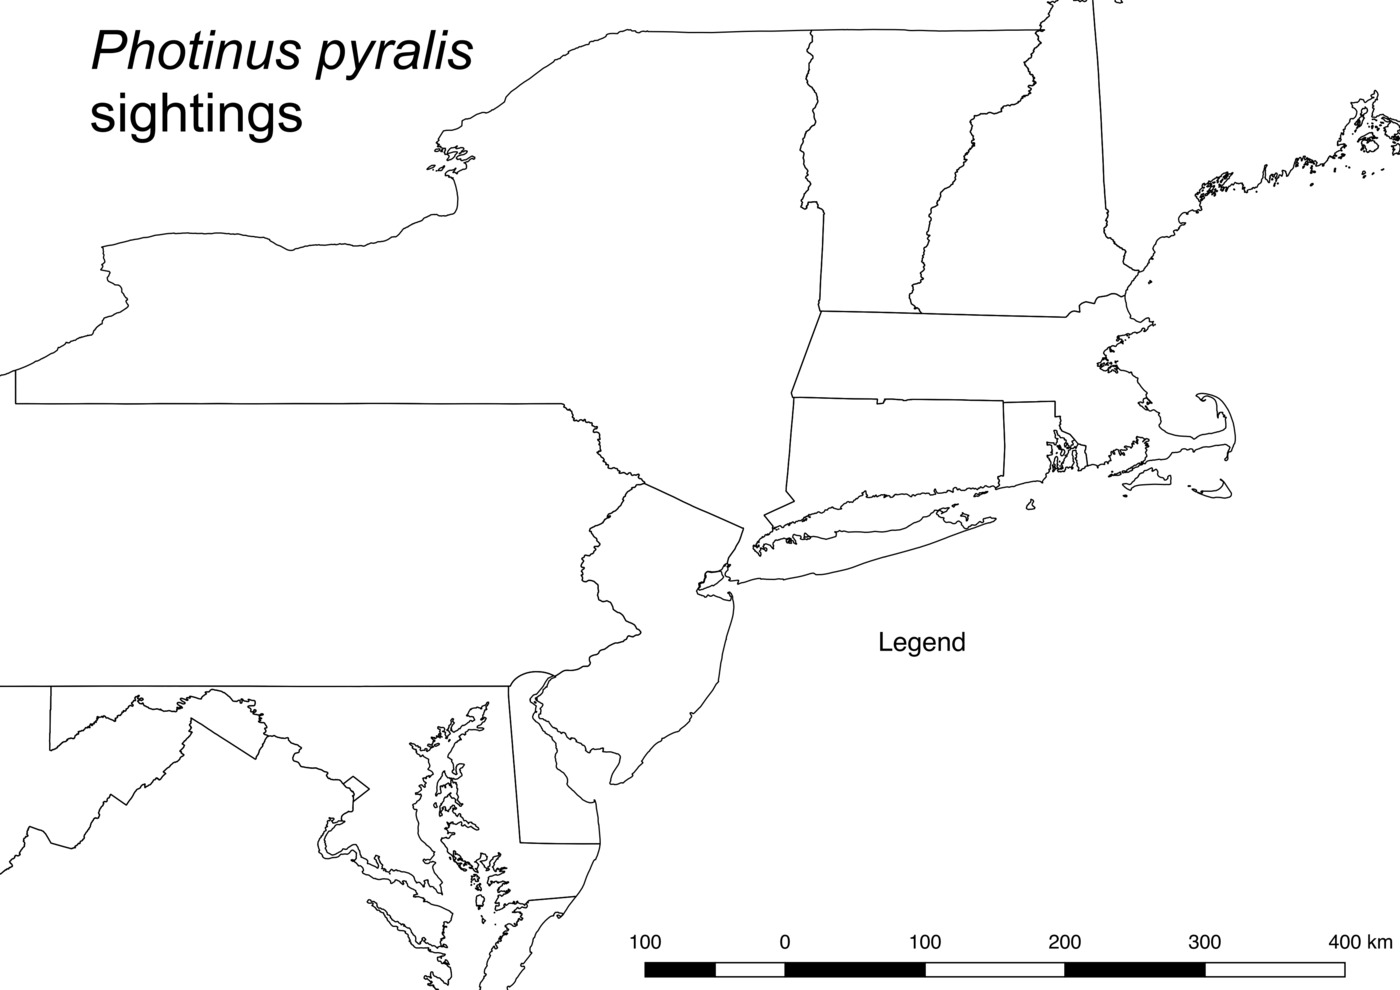 Figure 2. A blank GIS slate of the Northeastern United States
Note: To get started making and exporting maps like this: go to QGIS menubar -> New print composer. Whereas you do your actual formatting on the main QGIS window, you do things like add scale bars, add legends, and export to .SVG/.PNG/.PDF from the print composer. Once you add a map to the page (QGIS menubar -> Layout -> Add map), the print composer will show whatever you have currently showing in the main QGIS window. Hit the refresh button or export an image to see the updated map content.
Note: Another important concept is a Coordinate Reference Systems (CRS). In short, when you see a latitude & longitude value, those numbers are referring to a particular coordinate system, which on the planet Earth in 2018 is almost certainly the ‘WGS 84’ CRS. WGS 84 is the CRS associated with GPS coordinates. As it turns out, projecting the 3D sphere coordinates of a CRS onto a 2D plane for viewing on a computer monitor or map, is a bit of a challenge, and there are all sorts of odd solutions. In the case of WGS 84, most software when projecting this CRS keeps the latitude and longitude lines perpendicular which is accurate and looks pretty good for small areas, but for larger (continental) areas, it can look a bit weird & distort the areas, especially around the poles. The is the same problem as when Greenland looks huge in the Mercator projection. In case of the US, I’ve found that the NAD83 / EPSG:2265 CRS gives a curved projection that looks most like the classic “America” commonly seen on maps (but the projection is quite distorted outside the USA). When working in QGIS, make sure to keep the “On the fly” CRS transformation enabled to make everything automagically work, and if things start to get screwy, try to explicitly convert everything to the WGS 84 CRS.
Part 2: Climate data get
Next, I’ll overlay the “normal” minimum yearly temperature over this basic GIS map. I haven’t yet found a good resource for global climate data, but at least in the US, PRISM is a great solution.
I’ll download the following 2 raster GIS datasets from PRISM:
- 30-year normal Minimum yearly temperature (800m resolution, .asc format, WGS 84 CRS)
- Minimum yearly temperature for 2017 (4k resolution, .bil format, WGS 84 CRS)
Note: An important distinction to make at this point is the difference between GIS Shapefile/Vector data, and Grid/Raster data. Vector data, like the US State outlines imported above, are just that: polygons, lines, points, etc, whereas the raster data imported here are a georeferenced X-Y grid of some variable. In this case, temperature.
The purpose of using both the ‘30-year normal’ and more recent 2017 dataset is to provide an informative comparison: what is the “historical” climate that P. pyralis populations have been exposed to in recent memory, and how does it compare to more recent conditions?
If you’re asking, ‘why does the minimum temperature matter at all?’, Photinus fireflies spend most of their lives as larvae which stay underground hunting earthworms. These firefly larvae actually have to hibernate through one or more winters as they hunt and grow, until they are finally large enough to pupate into adults in the summer.
My hypothesis is that the main factor that prevents P. pyralis from spreading all the way to Boston, and possibly even into Rhode Island, is death over the winter due to being exposed to cold temperatures. But I didn’t (entirely) make up this hypothesis: This type of minimum annual temperature analysis is also the basis behind the ‘growing zone’ maps published by the USDA to advise where certain plants will grow3.
In the case of the map below, I present just the 30-year normal temperature minimum, where I’ve somewhat arbitrarily set the lower and upper coloration limits to 2˚C, and 10˚C, as that seemed to provide the most informative color gradients.
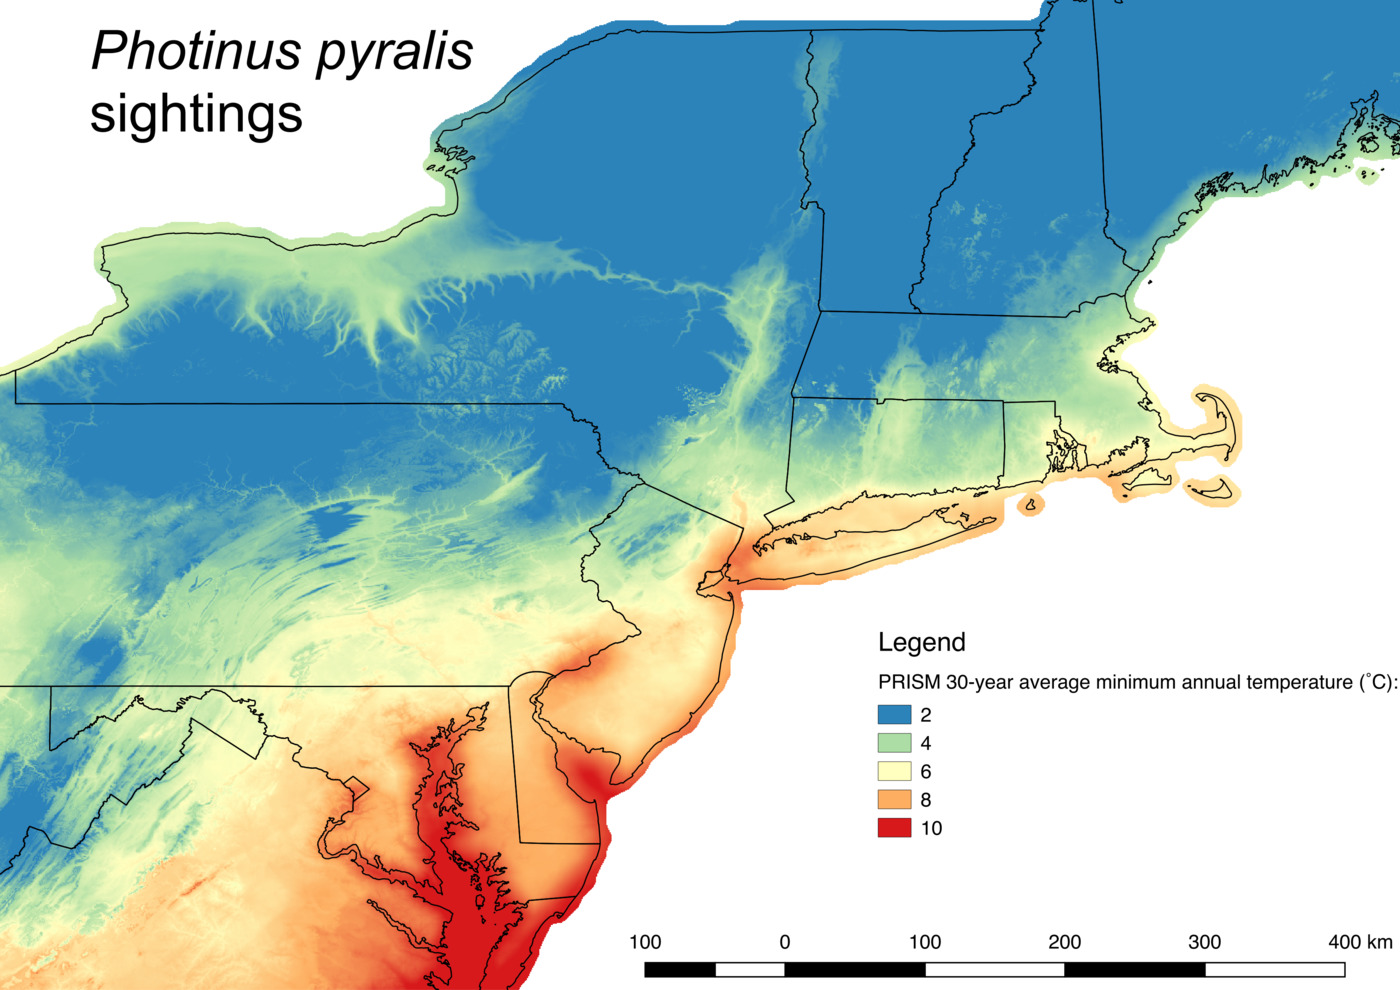 Figure 3. Northeastern United States overlaid with the PRISM 30-year normal minimum average temperature.
Note: To customize the color gradient show on the map, right click the PRISM min temperature gradient in the Layers sub-panel on the bottom left, select ‘Properties’, then select Style. Within style, you’ll want to set Render Type to ‘Singleband Pseudocolor’, the min to ‘2’, the max to ‘10’, and the color to ‘spectral’. For a shortcut, here is the style file you can load with Style (button, bottom-left) -> Load Style.
Part 3: High-resolution firefly sightings
Next, I’ll overlay some the P. pyralis sightings that have high resolution spatial-temporal metadata onto the map. In other words, I’ll be overlaying the sightings where we know the date of the sighting, as well as the GPS coordinates.
In practice, producing this GIS dataset took a custom QGIS Python script4, that parsed a CSV file exported from the spreadsheet that I keep continually updated with P. pyralis sighting data5, and then produced a new Vector GIS layer with points of the sightings. Afterwards, I had to map the climate data from Part 2 onto these newly created points using the QGIS ‘Add raster values to points’ feature. If you’d like to skip all that, I’ve provided the final dataset as a GeoJson file here.
Importantly these sightings includes the standard “presence” (P) records (in green), as well as more specialized “absence” (A) records (in red), where an expert fireflyer6 made the call that a site/habitat that seemed compatible with P. pyralis site didn’t in fact have them.
Calling absence records confidently is of course a bit tricky, as it is quite possible to have false negatives. For example, it may just be bad night for fireflies (e.g. too cold, or before or after the few week period when they may be out signaling), or for whatever reason that site is just a bad location for them (too many pesticides, etc.). But, mapping the limit of the P. pyralis geographic range requires that these ‘confident’ absence records are obtained.
Onto each point presenting a P. pyralis sighting (or absence), I’ve overlaid labels with the date of sighting, the 30-year normal minimum average temperature (from PRISM, in ˚C), and the 2017 average minimum temperature (also from PRISM, in ˚C):
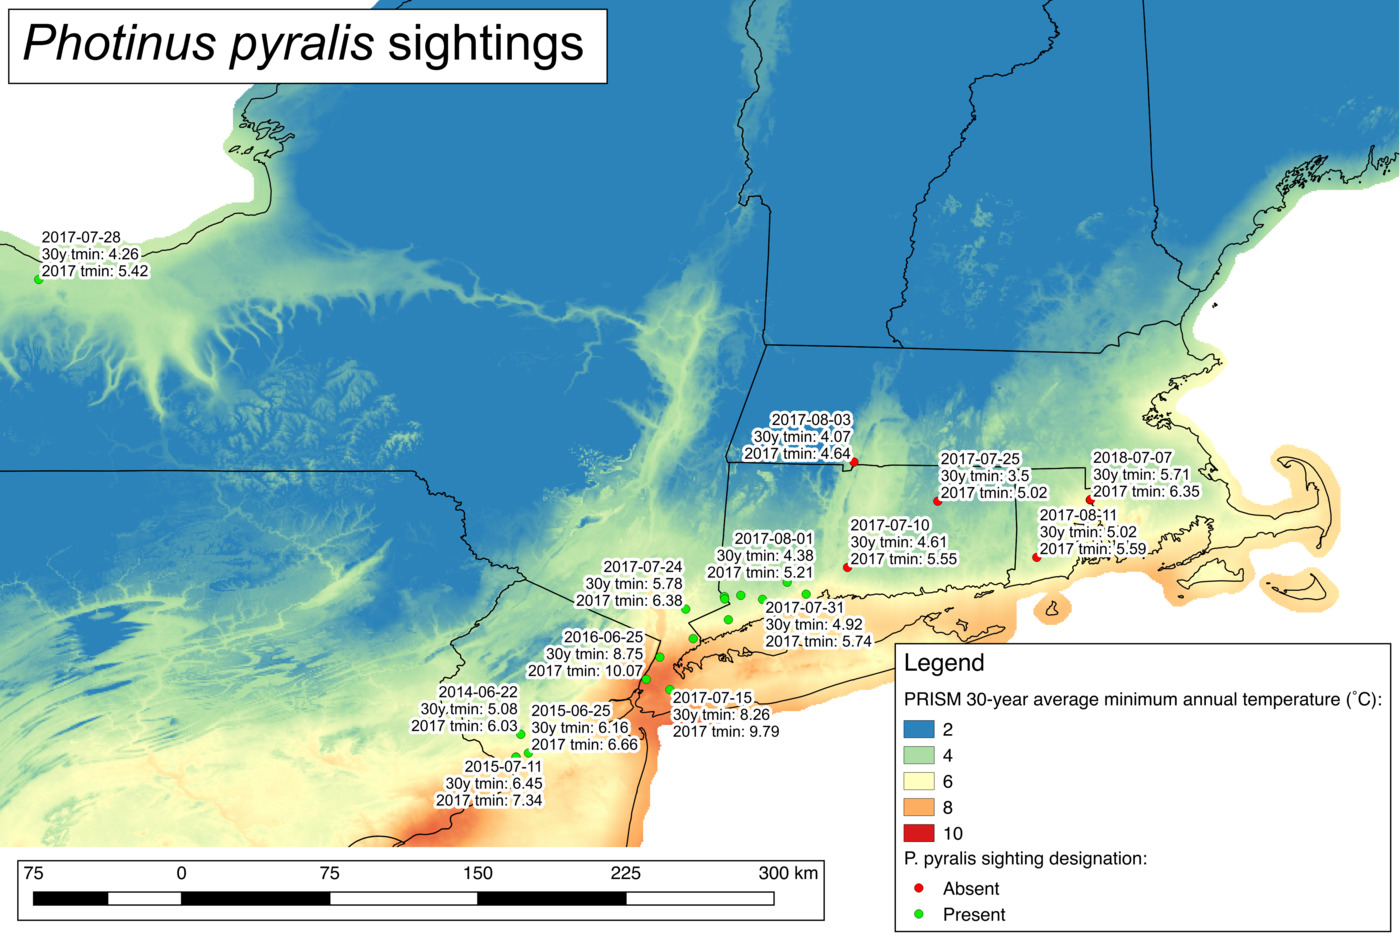 Figure 4. Northeastern United States overlaid with PRISM 30-year normal minimum average temperature, and Photinus pyralis sighting records. Sighting records are labeled with the date the observation was taken, the PRISM 30-year normal minimum temperature for that location, and the average minimum temperature from 2017.
There are a couple interesting interpretations from this map:
- Although Rochester NY is our most confident northerly record of P. pyralis, due to the climate-moderating effect of the Great Lakes the minimum temperature of this site (both the 30-year normal and more recent 2017 conditions) is pretty similar to that recorded for the New England coastal populations.
- Extrapolating a bit, an average annual minimum temperature of ~4.0˚C seems to be a reasonable absolute limit for robust P. pyralis populations (in Rochester), below which it seems reasonable to rule out populations. 4.75˚C may be a more conservative cutoff for the coastal New England populations.
- It seems that the coastal New England P. pyralis populations and the Rochester / Great lakes P. pyralis populations are not genetically linked via populations that go through the interior of NY state / the Hudson River valley. There is no bridge of >4.0˚C temperature (and hence, no P. pyralis), except for all the way around through Ohio/Appalachia! (Not shown on this map, but apparent on zooming out)
- There could well be some special genetic adaptations for the (slightly) colder weather that arose in the Rochester / Upstate NY P. pyralis populations, which haven’t made it over to the coastal New England populations, on account of these adaptations not being advantageous enough to spread through the “warmer” connecting populations that go through Ohio/Appalachia.
Note: The #2 heuristic above that ‘P. pyralis populations shouldn’t be found in regions below a ~4.0˚C average minimum temperature’, doesn’t match our greater P. pyralis sighting dataset (Figure 1), as a couple of P. pyralis records are found in fully <2.0˚C counties in NY. Is the <4.0˚C = no P. pyralis heuristic wrong? Or are these records from locally warm areas in otherwise cool mountainous terrain? Or are the records themselves wrong? Only more data will solve this!
Note: The trick for this figure is the Legend style with the P. pyralis sightings. To see how this was done and/or tweak the style, first right click the layer with the P. pyralis sightings, go to ‘Legend’, and then load this style file. The special string in the ‘Label with’ textbox defines the special 3-line label.
Part 4: Zooming in
Let’s zoom in to the Massachusetts / Rhode Island area a bit more, and try add a couple more datasets to go into more depth:
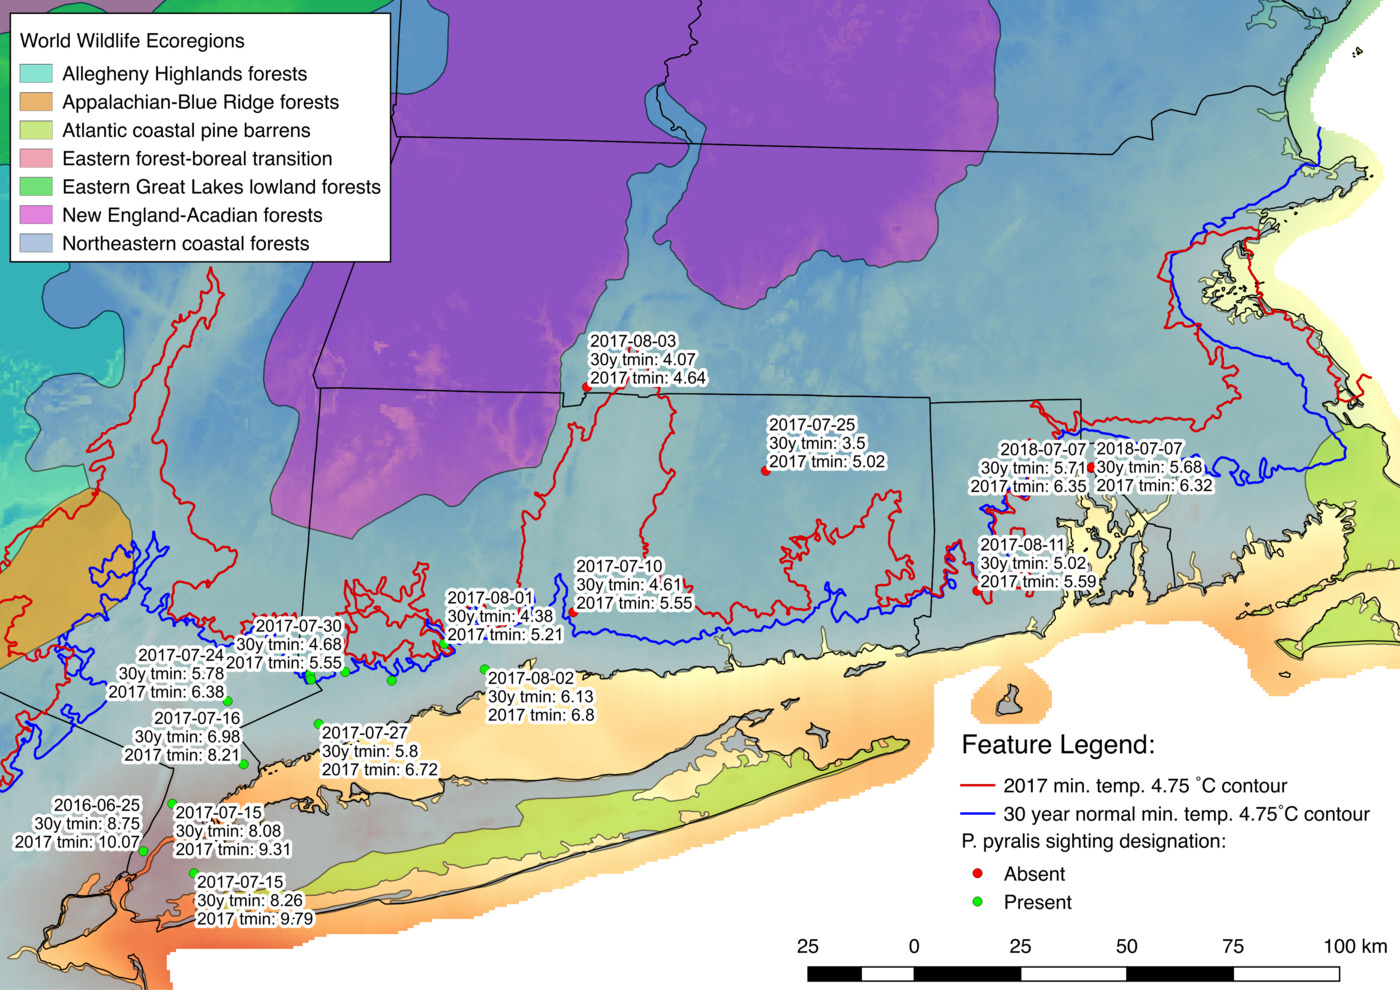 Figure 5. Zoomed in analysis
First off, to better understand the ecological interactions that could be coming into play with the P. pyralis geographic range, I added the World Wildlife Fund Terrestrial Ecoregions to the map. In a nutshell, these WWF ecoregions try to classify the flora and fauna that exist around the world into clusters, the so called ecoregions. To a first approximation, if a species is found in one part of an ecoregion, and the same climatic conditions are contiguous with another part of the ecoregion, then I’ll make the assumption that the species range extends to the other part of the ecoregion as well.
Applying these expectations: even though we don’t have direct data for the presence of P. pyralis all the way out west on Long Island, it seems the northern coast of Long Island should have P. pyralis all the way out to the eastern edge (Figure 5). Analogously, the southern ‘Pine Barren’ ecoregion of Long Island may not have P. pyralis. I know Cape Cod definitely doesn’t have P. pyralis (although it does have other firefly species)
The other features that I’ve added to the map are the 4.75˚C contour line for the 30-year normal minimum temperature (red), and the 4.75˚C contour line for the 2017 average minimum temperature (blue). As I noted in Part 3, this 4.75˚C contour line seems to be a conservative cutoff for a suitably warm climate for P. pyralis along the New England coast. In areas that are on the warm (southern) side of this line, we should expect that it is warm enough for P. pyralis. The key results from this are:
- There are large expansions in the ‘warm enough’ regions from the 30-year to the 2017 average (#climatechange). The most notable expansions seem to be in the Hudson River Valley, and the Connecticut River Valley (Pioneer valley)
- For the 30-year average minimum temperature, P. pyralis populations could extend all the way to Boston, if it were not for the intervening Pine-Barren ecoregion along Cape Cod which may not be suitable for P. pyralis.
Part 5: Conclusions
- Using the simple and hypothetical heuristic that the P. pyralis range should extend to all areas which are contiguous to known sites of P. pyralis in terms of ecoregion and climate (aka average minimum temperature), the above analysis suggests that Rhode Island’s climate and ecosystem conditions are compatible with robust P. pyralis populations. I therefore reject the hypothesis that the climate in Rhode Island is not suitable for P. pyralis. Seems warm enough along the coast, and should have the right earthworms (ecoregion) for the fireflies to eat! That being said, by this same shared climate/ecoregion criteria, there should also be P. pyralis populations in south-eastern Massachusetts, and possibly just south of Boston! Seems unlikely that these Massachusetts populations wouldn’t have been reported at all to date, so there may be alternative factors and hypotheses to explain why the P. pyralis range doesn’t extend where it ‘should’.
A first alternative hypothesis: Although the climate along the New England coast is suitable for P. pyralis, it may be that the local ecosystems are quite different (e.g. not enough earthworms and/or different earthworm species that P. pyralis don’t like, and/or key predators that show up further north). Unlike the PRISM climate model (which I think is relatively reliable), there is almost certainly much more local variation in ecosystem composition & microhabitats, and subtle variation in ecosystems may be quite important for successful expansions of P. pyralis. Without having a better understanding of what exactly P. pyralis larvae eat, what their other major ecological interactions are, and how these ecosystems vary up the New England coast, hard to say much more.
A second alternative hypothesis to explain why P. pyralis don’t extend up the New England coast despite ‘suitable’ conditions could be dispersal dynamics: P. pyralis seem to be better adapted towards meadow-like and/or disrupted forest-edge habitats. If there is a very thick/dense forest, this might act as a barrier to P. pyralis dispersal, and as an example that would keep them from dispersing from one meadow to a fairly new meadow on the other side of the forest. These dispersal dynamics should be especially important along the edge of the species range, where due to regular ‘pruning’ of the population (e.g. a cold winter), the harder to get to places won’t establish robust popultaions. That being said, society has produced impromptu meadows all over the place with suburbia, interstate highways, high-voltage power lines, and your bog-standard roads, so it seems like P. pyralis should generally be able to get most places where humans are.
Part 6: Future directions
The only path to solving this question of the distribution of P. pyralis along the New England coast seems to be to get more data! An interesting avenue is the continuing use of iNaturalist, which so far has been a pretty powerful powerful method to easily gain new species observations from large areas. P. pyralis is also a bit unique amongst fireflies in that it has key characteristics which make identification via photo or video of the flash pattern possible. A next step will be making a list of iNaturalist P. pyralis observations which get the gold seal of manual approval that they are truely P. pyralis.
Given the interesting result in Figure 5, in which the Pioneer Valley in Connecticut and Massachusetts might be suitable for P. pyralis, a personal goal for this summer is drive out to Western MA and check sites along the Connecticut river for them. From a dispersal perspective, as this river valley has been well-settled and farmed for centuries, I think it is pretty likely that it has been friendly to P. pyralis dispersal for a long time. The recent (<10 year?) warming of the River Valley might have allowed P. pyralis populations to expand up its banks.
But beyond that, technically I’m a biochemist, not a ecologist! So I will likely not get much deeper into questions of the P. pyralis ecological niche and geographic distribution than this blog post and continuing to update the spreadsheet5 with confident P. pyralis presence or absence records. I hope this post may at least stir some interest in these questions by my more ecologically oriented colleagues.
Further reading
A really nice paper which demonstrates that Degree-days, not calendar days, might be a better way to predict when adult fireflies are going to emerge:
- Faust, L.F., and Weston, P.A. (2009). Degree-day prediction of adult emergence of Photinus carolinus (Coleoptera: Lampyridae). Environmental Entomology 38, 1505–1512.
the rationale given by Professor and Nobel Laureate Bob Horvitz in MIT’s graduate genetics class, to justify why he prepared the cellular map of C. elegans development that later led to his Nobel Prize. ↩︎
https://deepblue.lib.umich.edu/bitstream/handle/2027.42/56374/MP130.pdf ↩︎
https://github.com/photocyte/2017_misc_scripts/blob/master/Ppyralis_QGIS_sighting_to_lat_long_point.py ↩︎
https://docs.google.com/spreadsheets/d/1NaCahTtTBicowuA5-eYYnQMwdtTgZn7EQxfTrlFL54w/edit?usp=sharing ↩︎ ↩︎2
Fireflyer: noun. short for firefly chaser. a person who thinks about lightningbugs. ↩︎
